50+ countries
Global use, local impact

47 years in business
Originated in 1979

50+ employees
Europe, USA and Asia

2000+ customers
More than 20.000 users
Blog: SPC Software Return on Investment (ROI): How to Calculate the Business Value of Statistical Process Control
Introduction
Manufacturers rarely purchase SPC software simply because they want better control charts. They invest in Statistical Process Control because they want to reduce variation, prevent defects, lower scrap and rework, improve process capability, and identify problems before they become expensive. That raises an important question: How much financial value can SPC software actually create?
The answer depends on your manufacturing processes, but the business case can be calculated. This blog explains how to estimate the potential return on investment (ROI) of SPC software by looking beyond the software license and measuring the cost of poor quality, manual data collection, delayed problem detection, scrap, rework, and quality escapes.
What Is the ROI of SPC Software?
SPC software ROI is the financial return generated by improving how your organization monitors and controls manufacturing processes compared with the total cost of implementing and operating the software.
A simple calculation is: ROI = (Annual benefits − Annual software costs) ÷ Total investment × 100
For example, if an SPC implementation costs €20,000 per year and generates €150,000 in measurable annual benefits: ROI = (€90,000 − €20,000) ÷ €20,000 × 100 = 350%
However, calculating SPC ROI is not as simple as looking at the software subscription price. The benefits can come from several different areas.
Where Does SPC Software Create Financial Value?
The most important sources of potential value are:
- Reduced scrap
- Reduced rework
- Fewer quality escapes
- Lower customer-return costs
- Reduced inspection and data-entry labor
- Faster detection of process problems
- Improved process capability
- Reduced downtime associated with quality problems
- Faster root-cause investigations
- Better use of quality-engineering resources
- Improved rating in (potential) customer assessment
Not every organization will benefit equally from every category. The objective is to identify the areas that matter most to your operation and quantify them using your own data.
1. Calculate Your Cost of Scrap
Scrap is often the easiest place to start. Suppose your plant produces €20 million of product annually and your scrap rate is 2%. That represents: €20,000,000 × 2% = €400,000 of scrap.
Now suppose improved process monitoring could reduce preventable scrap by 10%. That would represent: €400,000 × 10% = €40,000 annual savings from material cost.
A 10% improvement may sound modest. But when applied to a large manufacturing operation, even small percentage improvements can become significant.
Your calculation:
Annual scrap cost × preventable percentage = potential SPC-related savings. The important word is preventable. Not all scrap is caused by process variation that SPC can address. Use historical quality data to identify the portion associated with unstable or drifting processes.
2. Calculate Rework Costs
Scrap is visible. Rework is often less visible because the product eventually becomes saleable. But rework still consumes:
For example: Suppose your plant spends €300,000 per year on rework. If better process monitoring reduces preventable rework by 15%: €300,000 × 15% = €45,000 annual savings
Add that to the potential scrap reduction: €40,000 + €45,000 = €85,000. And we haven’t yet considered quality escapes or labor savings.
3. Calculate the Cost of Quality Escapes
One of the strongest arguments for real-time SPC is that finding a problem earlier can be dramatically less expensive than discovering it after the product has left the factory. Consider the difference between: Detecting a process shift after 5 parts and Discovering it after 5,000 parts. The earlier the problem is detected, the smaller the potential affected population.
Quality escapes can create costs such as: Customer complaints, Returns, Expedited shipping, Replacement products, Warranty claims, Field service, Customer penalties Lost production capacity, Engineering investigation, Damage to customer relationships. These costs can be much greater than the original manufacturing defect.
A Simple Quality Escape Calculation
Start by examining your historical quality data. For example:
| Metric | Annual Value |
| Customer returns | €150,000 |
| External sorting | €50,000 |
| Warranty costs | €100,000 |
| Expedited shipments | €25,000 |
| Customer quality charges | €75,000 |
| Total | €400,000 |
Now determine what proportion could reasonably be associated with process variation that earlier SPC detection might have prevented. If you estimate 15%: €400,000 × 15% = €60,000 potential annual savings. This should be treated as an estimate rather than a guaranteed saving. The quality of your ROI model depends on the quality of your underlying data.
4. Calculate Manual SPC Labor
This is one of the most overlooked sources of ROI. Ask your team how much time is spent:
Suppose: 20 operators spend 30 minutes per shift on manual SPC data activities. There are 2 shifts per day, and there are 250 production days per year. That represents: 20 × 0.5 × 2 × 250 = 5,000 labor hours per year. At a fully loaded labor cost of €30/hour: 5,000 × €30 = €150,000. Even if automation eliminates only 40% of this work: €150,000 × 40% = €60,000 annual opportunity. The important point is not that every organization will save this exact amount. It is that manual SPC has a measurable cost.
5. Calculate Quality-Engineering Time
The same principle applies to quality engineers. Suppose five quality engineers each spend 5 hours per week managing SPC-related administrative tasks. That’s: 5 × 5 × 50 = 1,250 hours per year. At a fully loaded cost of €60/hour: 1,250 × €60 = €75,000. If automation reduces this administrative workload by 50%: €75,000 × 50% = €37,500. But there is an important additional benefit. You may not actually reduce headcount. Instead, your engineers can spend those recovered hours on higher-value activities such as:
That can create value beyond the direct labor calculation.
6. Calculate the Cost of Delayed Detection
This is where real-time SPC can become particularly valuable. Imagine that a process begins drifting at 08:00. With manual SPC, the condition might not be identified until the process is reviewed later. With automated SPC, the system may identify the statistical signal much sooner. The financial impact depends on production rate. Suppose:
Potential production affected: 120 × 3 = 360 parts. At €20 per part: 360 × €20 = €7,200. This does not mean all €7,200 is necessarily a cost. Some parts may be acceptable, some may be reworked, and some may be scrapped. The calculation is intended to demonstrate the relationship between detection time and exposure.
7. Process Capability Can Have a Significant Financial Impact
SPC is not only about preventing failures. It can also help manufacturers improve processes. Suppose a process is technically capable of meeting specification but operates with excessive variation. A process with improved capability can potentially deliver less scrap, less rework, more predictable production, fewer inspections, greater process stability and more consistent product quality. This is particularly relevant for high-volume manufacturing. Even a small reduction in variation can produce meaningful savings when multiplied across millions of parts.
8. Don’t Forget Inspection Costs
Manual inspection itself has a cost. Better process control does not necessarily mean eliminating inspection. However, stable and capable processes may allow organizations to make better decisions about where inspection resources provide the greatest value.
Any changes to inspection requirements should, of course, be based on the organization’s quality system, customer requirements, and applicable standards.
9. Calculate the Value of Faster Root-Cause Analysis
When a quality problem occurs, engineers need to understand: What happened? When did it start? Where did it happen? What changed? Which machines, operators, materials, or production orders were involved?
If the necessary information is distributed across spreadsheets and databases, investigation can take hours or days. A centralized SPC system can make historical process data easier to search and correlate. That can reduce the time required to investigate problems. For example:
Suppose your quality team performs 100 investigations per year. Average investigation time: 6 hours. Annual investigation effort: 600 hours
If better data access reduces the average investigation by 20%: 600 × 20% = 120 hours recovered. Again, the value may not be a headcount reduction. It may simply mean that your engineers can solve more problems with the same resources.
Building Your SPC ROI Model
A practical ROI model can be divided into two sides.
Potential annual benefits
| Benefit | Annual Opportunity |
| Scrap reduction | €40,000 |
| Rework reduction | €45,000 |
| Quality escape reduction | €60,000 |
| Operator labor | €60,000 |
| Quality engineering time | €37,500 |
| Faster investigations | €10,000 |
| Total potential benefit | €252,500 |
These numbers are illustrative. Your own model should use actual plant data wherever possible.
Now Calculate the Cost
The investment side should include more than the software license. Consider:
For example:
| Investment | Year 1 |
| Software | €40,000 |
| Integration | €15,000 |
| Training | €10,000 |
| Hardware | €15,000 |
| Total | €80,000 |
If annual benefits are estimated at €252,500: Net benefit = €252,500 − €80,000 = €172,500
And: ROI = €172,500 ÷ €80,000 × 100 = 216%
The payback period would be approximately: €172,500 ÷ €80,000 × 12 = 5.6 months
Again, this is an illustrative example, not a guarantee of SPC software performance.
This is the first year in case of CAPEX. In second year cost would be 20% of the software investment which is €8,000 and other cost are not there anymore. The value of improved customer rating is hard to predict. Have you lost potential customers because of low rating in quality and process control. The value of getting a new customer because they see your company has an excellent continuous improvement system in place might be much more value than the cost savings.
Build a Conservative, Expected and Optimistic Scenario
A strong business case should not rely on one optimistic number. Create three scenarios.
Conservative: Assume only modest improvements. For example:
Expected: Use improvements supported by historical data, pilot results, or comparable processes.
Optimistic: Model the potential result if the implementation performs particularly well. This provides management with a more credible range. For example:
| Scenario | Annual Benefit | Year 1 ROI |
| Conservative | €120,000 | -20% |
| Expected | €250,000 | 67% |
| Optimistic | €400,000 | 167% |
The objective is not to make the numbers look attractive. It is to understand what level of improvement is required for the investment to make financial sense.
The ROI of SPC Is Often About Prevention
One of the challenges with SPC ROI is that the biggest benefits are sometimes the events that never happen. If a process shift is detected early and 5,000 defective parts are never produced, there may be no large quality event appearing in your financial records.
That makes prevention harder to measure than correction. This is why historical data is so valuable. Look at previous events and ask: “What would this problem have cost us if we had detected it one hour earlier?”
Then ask: “What would it have cost us if we had detected it one shift earlier?” This can reveal the economic value of faster process detection.
A Simple SPC ROI Calculator
You can create a basic internal calculation using the following inputs.
Manufacturing
Quality
Labor
Software
Then estimate realistic improvement percentages. The result is a business case based on your manufacturing economics, rather than a generic claim about SPC software ROI.
What About AI?
AI can potentially add another dimension to the value equation. Modern manufacturing systems increasingly use machine learning and advanced analytics to identify patterns across large datasets. Potential applications include:
However, AI should not be treated as a substitute for sound SPC fundamentals. Reliable measurement data, appropriate statistical methods, and well-defined processes remain essential. A useful way to think about it is: Reliable data → SPC → Analytics → AI-assisted insight → Action.
The quality of the output depends heavily on the quality and context of the underlying data.
How to Prove SPC ROI With a Pilot
If management is uncertain about the business case, a pilot can be more persuasive than a theoretical calculation. Choose one process with significant production volume, known quality variation, meaningful scrap or rework, frequent measurements and a measurable improvement opportunity. Establish a baseline and then measure:
Implement automated SPC. Then compare the results. The pilot provides actual evidence that can be used to justify a larger rollout.
Don’t Measure Only Software Savings
One mistake companies make when calculating ROI is focusing exclusively on administrative savings. For example: “The software will save our quality engineers 1,000 hours.”
That’s useful. But the larger opportunity may be: “The software helps us identify process problems before they produce thousands of defective parts.”
The strongest SPC business cases therefore combine: Efficiency + Quality + Risk Reduction + Process Improvement
The Six Numbers to Start With
If you want to build an SPC business case quickly, start with these six numbers:
These six numbers can provide the foundation for an initial ROI estimate.
What Makes an SPC Business Case Credible?
A credible ROI calculation should be based on your data (use actual scrap, rework, labor, and quality costs whenever possible), it should be conservative (do not assume that SPC software will eliminate all defects), traceable (document how each estimate was calculated), measurable (define the KPIs you will use after implementation) and it should be testable (validate assumptions through a pilot). The goal of the business case is to determine whether the potential financial value justifies the investment.
SPC Software ROI: The Bottom Line
The business case for SPC software is rarely about control charts alone. It is about improving the economics of manufacturing. By collecting process data more efficiently, identifying abnormal behavior sooner, reducing manual work, improving traceability, and helping teams respond faster, an effective SPC implementation can potentially generate value across several areas of the organization.
The most useful ROI calculation starts with your own numbers. Calculate: Scrap + rework + quality escapes + SPC labor + investigation time + other measurable quality costs
Then estimate the portion that is realistically preventable or reducible. Compare that opportunity with the total cost of implementing and operating SPC software. The result gives you a much stronger basis for deciding whether an SPC investment makes financial sense.
Want to Calculate Your SPC Software ROI?
Start by gathering your last 12 months of:
With these numbers, you can build a realistic SPC business case rather than relying on generic ROI claims. Below and example of the ROI calculation. You can download the spreadsheet here.
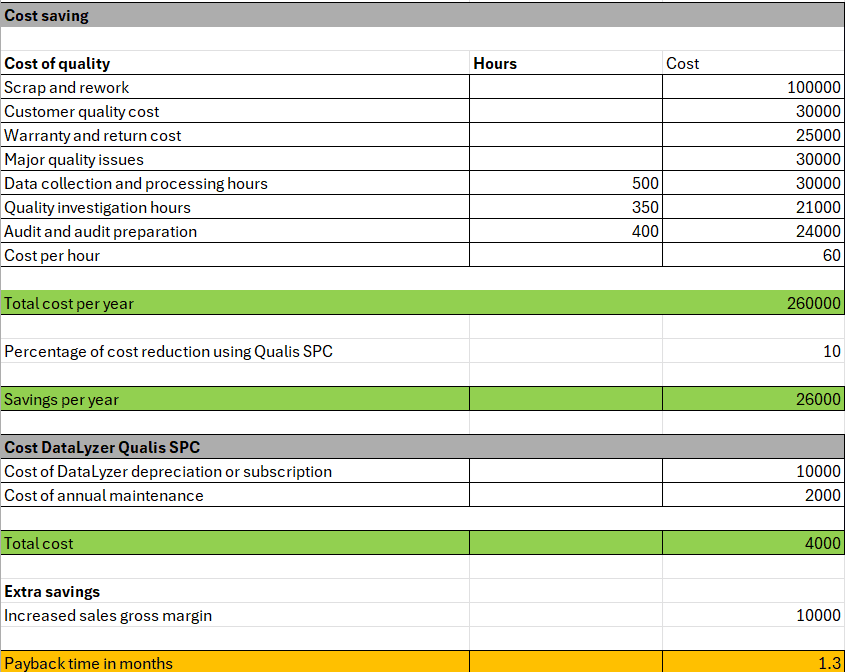
Request an SPC software demo or discuss your SPC requirements with our team. And if you are still evaluating which capabilities you need from an SPC platform, see our guide: The 2026 Guide to Choosing SPC Software: 27 Requirements Every Manufacturer Should Evaluate.
9%
Cost Reduction Achieved by customers


What customers say
“Datalyzer helped us automatically link quality data from all processes for advanced analysis”
Dave Beeren
Yield Engineer, Philips
Industries we serve

ISO Certified
ISO 27001 & SOC2