Introduction
Reverse FMEA (R FMEA) is a structured process of continuous improvement that is aimed at ensuring the permanent updating and progress of an FMEA (Failure Mode and Effect Analysis) study. This risk assessment method is based on the actual situation and not predictive reliability.
We see more and more OEM companies requesting R FMEA. For example, Ford, GM and Renault request it as part of their Customer Specific Requirements (CSR).
The request for R FMEA is emerging, because the FMEA process is less effective than it is supposed to be and because one of the most essential steps in the FMEA process is not always implemented properly. For an FMEA to be effective it is required to regularly review the FMEA and keep the FMEA as a truly living document. Companies often don’t have this continuous improvement cycle properly implemented and OEM companies are requesting R FMEA as a solution to this problem.
There is no generic standard on how R FMEA’s should be performed. Only the French organization FIEV has a guideline where it describes how a R FMEA should be done. If you read multiple articles, you will find multiple approaches. Common steps which can be found in most discussions about R FMEA are:
1. Review of the current process flow
2. Verification of effectivity of the controls and actions
3. Identify new potential failure modes
4. Verify correctness of the SOD ratings
5. Update relevant output and FMEA associated documents
Other steps mentioned are how to organize the R FMEA process, how to report and which templates to use or even introduce defects on purpose into the process and verify if these defects are detected in the process.
In this blog we will explain how the R FMEA process can be implemented using DataLyzer FMEA, MSA and SPC to make the FMEA a truly living document. But we will also explain some of the complications you will encounter implementing Reverse FMEA.
DataLyzer solution for R FMEA
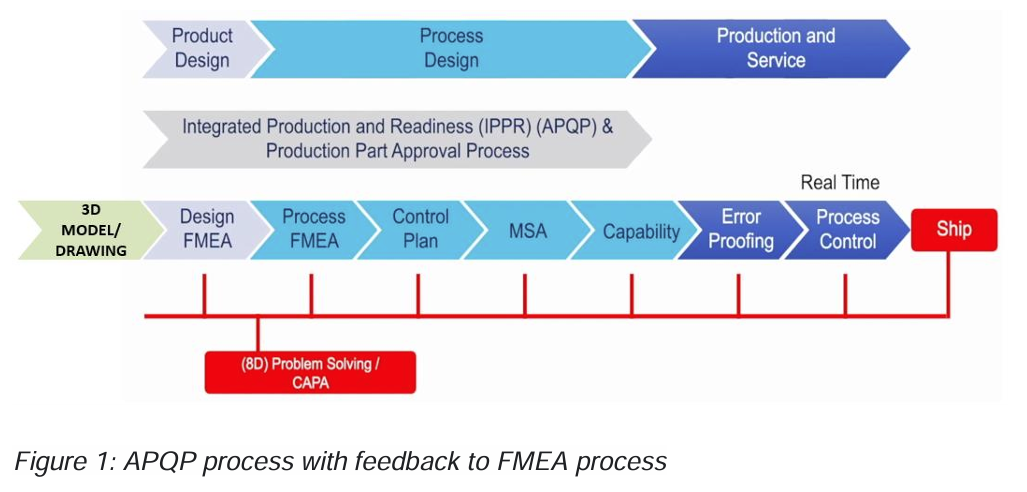
What R FMEA basically is, is a periodic review of the FMEA, a validation of your FMEA process. But it would be much better if the FMEA is reviewed continuously as it was supposed to be in the original APQP requirements. The original requirements are shown in the graph below
Let’s discuss the 5 common steps and see how they can be implemented in an integrated solution for FMEA, MSA and SPC.
Step 1: Review of the current process flow:
When we review the current process flow the first step is to establish the scope of the review. The DFMEA, PFMEA or Control Plan often have a sequence of process steps. In an inspection or SPC these sequences of process steps are divided into smaller steps related to a workstation or even an inspection step related to one or more workstations. So, integration of FMEA and SPC will not directly help, except when you need to set up the inspection on the shop floor where irregularities within the process flow definition might turn up and can be corrected.
In this step there is a complication when you define the scope. When you look at process product combinations there might be many FMEAs related to a process. We can have one or more reference (foundation) FMEAs and a larger number of specific FMEAs and Control Plans. Every specific part produced with a process might have their own FMEA. In principle all these FMEAs should be reviewed. The recommendation is to at least review the reference FMEA as it is common for all FMEAs and will provide the correct basis. If in specific FMEAs you add process steps to the reference FMEA you need to review these as well.
Step 2. Verification of effectivity of the controls and actions and Step 3. Identify new failure modes:
We like to discuss these 2 items at the same time because they are very much related. To implement effective controls and effective reaction plans to problems (OCAP) the following steps are performed:
1. Establish all failure modes, effects, and causes
2. Implement improvement actions and controls
3. Define out of control action plan (OCAP) (Last column of the Control Plan)
4. Implement OCAP in SPC system
5. Train the people
What does this look like in practice?
In the SPC system for every out of control or out of specification the users will add a potential cause and the action taken. They will take a remeasurement to validate if the action was effective and the problem is solved. If the action is not effective or the problem appears too often, we need to take a preventive action to eliminate the problem or investigate the right solution.
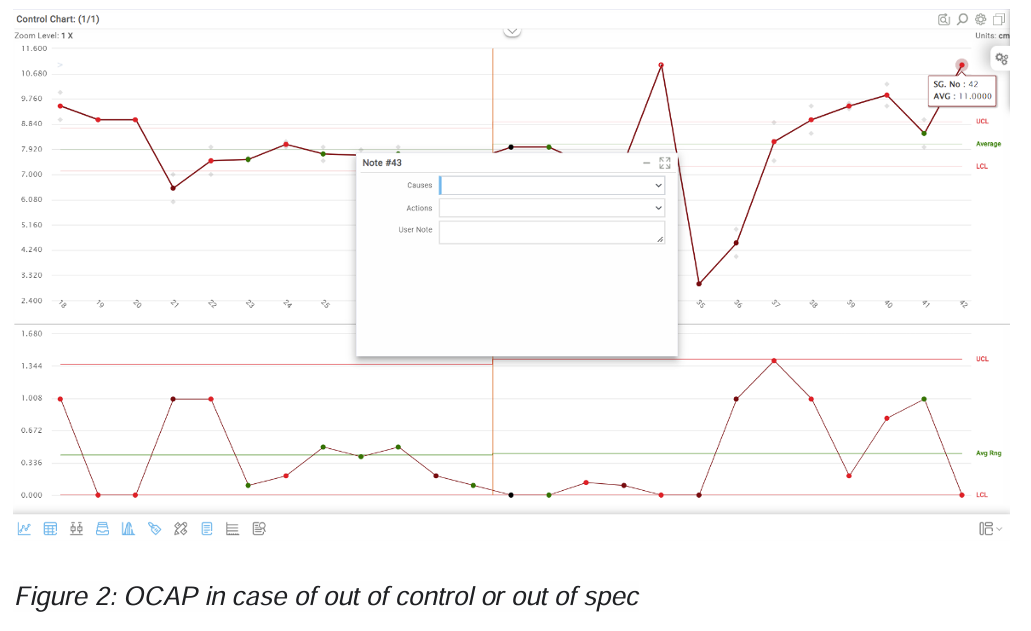
In figure 2 you see an example of the OCAP screen. The complete list of causes will be available for the user and based on the cause the user can take the appropriate action. To make this possible, predefined cause and action lists can be created and links between causes and actions can be established. This list can be made based on the control plan. The list can be verified on the shop floor and omissions can be fed back into the FMEA process.
Now there are a few possibilities when using the OCAP:
1. The user cannot find the right cause and action for the problem, so the problem is escalated to a higher level.
2. The user knows what the problem is but the problem is not identified in the OCAP so the user makes a free form note indicating what the issue is and how it can be solved.
Ad 1: If the user cannot find the cause of the issue then either the user is not properly trained, or the problem has not been identified. In both cases it means current controls are not effective and the problem should be analyzed and users need to be trained or a potential new failure mode is present and needs to be added to the FMEA.
One example of a way to utilize DataLyzer SPC in this case is by revisiting the process notes and actions of each abnormality in the charts (OOC, OOS etc.).
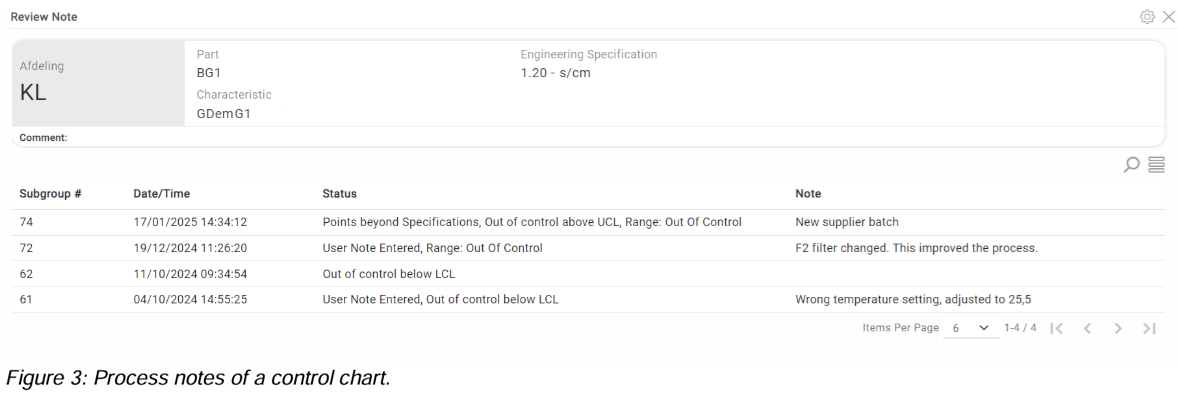
Figure 3 shows an example of process notes in a control chart. By looking at the high occurrences (7 OOCs in a week) and the notes, there is a high possibility something is wrong in the process, causing these frequent false alarms and this is an indication of a new failure mode not recognized.
Ad 2: If the problem is known but not identified in the FMEA the FMEA needs to be adapted.
The examples above are exactly what is meant by “2. Verification of effectivity of the controls and actions and 3. Identify new failure modes”, so instead of having costly reviews where it is not always possible to identify all problems it should be integrated into the current process. There is an additional possibility which is not described above and that is that the problem is caused by a previous process out of scope of the existing FMEA or that a problem caused in this process will be found later for example during assembly or testing.
To make sure problems are properly addressed during the analysis of an issue it needs to be communicated with the owner of the appropriate FMEA. This is also the case for customer complaints therefore updating the FMEA should be an integrated part of the corrective and preventive action in the R FMEA process. In a proper SPC implementation it must be possible to provide feedback from the shop floor to the responsible FMEA engineer and this is sometimes a lot more complicated than it sounds. Because, how do you know which FMEA is related? Like we mention above, we might have many FMEAs related to a control chart.
So, who do we inform in case an issue is found? All FMEA owners or only the owner of the references FMEAs? For each company this might be different: In some cases it is easy and a control chart is directly linked to only 1 FMEA. In other cases, it might be much more complex and a review step needs to be implemented in between to analyze which FMEAs will be affected by the issue found.
But overall, making the Control Plan and FMEA review an integrated part of the OCAP process is an extremely effective and efficient way of implementing this part of the R FMEA.
In addition to integrating the FMEA review in the OCAP process we also need a review step when we adapt attribute control charts. In figure 4 you see an example of an attribute control chart.
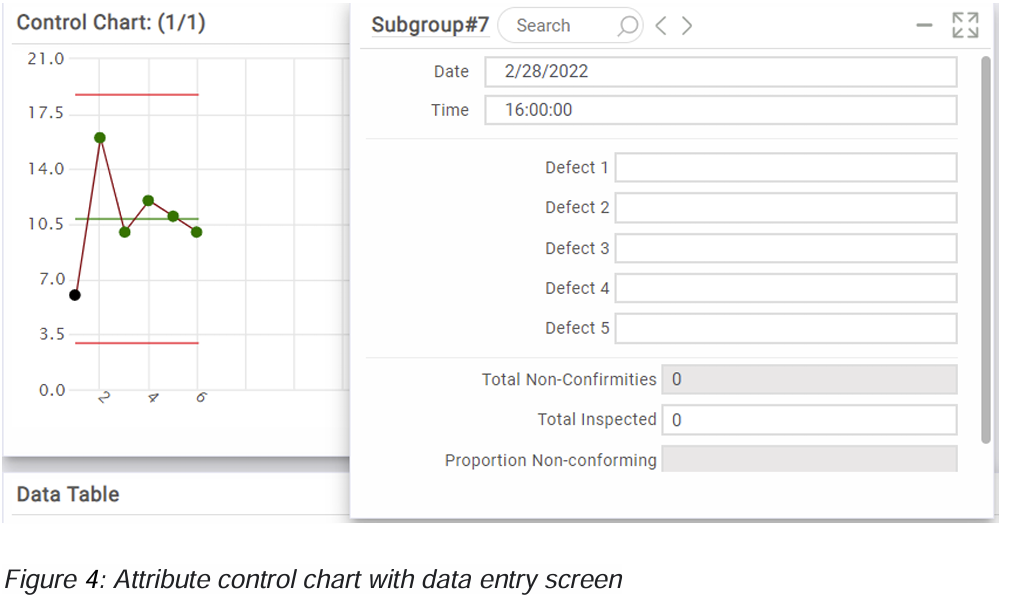
If we inspect a product and find a new defect which is not described yet we can add it to the attribute control chart e.g. defect 6, but in that case we also need to review the FMEA where the defect should be added as a potential failure mode and the effect of the failure mode needs to be analyzed.
Step 4. Verify correctness of the SOD ratings:
In FMEA we use severity, occurrence and detection (SOD). Of course, severity is not something which can be verified in the process, so we are looking at occurrence and detection.
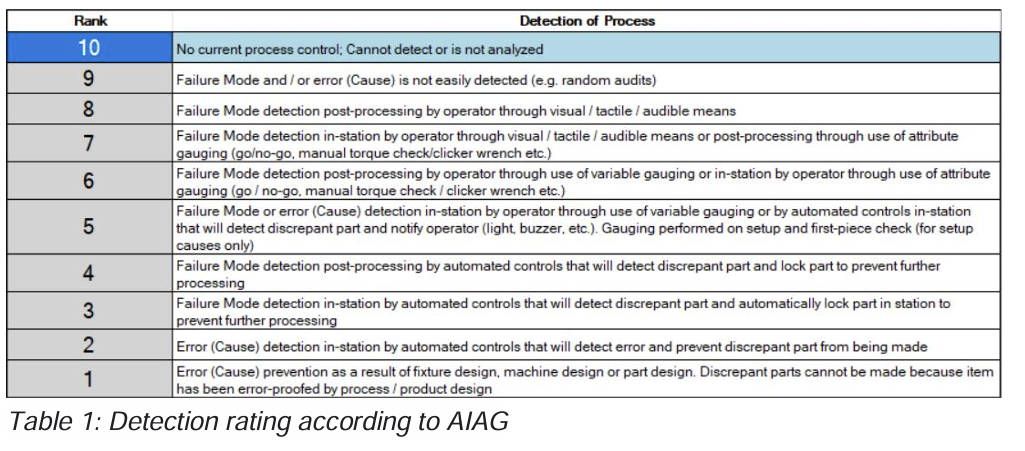
For detection the rating is well defined (see table below) so we only might need to analyze the occurrence rating 2,3 and 4 if the performance of the measurement is adequate with an MSA study.
In table 2 we see the occurrence rating according to AIAG.

For attribute charts these occurrences directly relate to the percentage of defects. For variable studies we can easily calculate the predicted percentage out of specification based on the distribution curve and the specifications.
In figure 5 we see the predicted percentage out of specification which is the sum of % above USL and % below LSL.

In this case we expect 0.9812% out of spec, so we take the next higher rating which is a 7. (1 in 100). The occurrence rating in our FMEA should be in line with the results found in the SPC system.
Could we use Ppk as an indication for occurrence? Not really because Ppk only looks to the most critical specification limit, but if we assume that the process is on target and we have 2-sided specification limits the following table gives an indication of the relation between Ppk and occurrence.
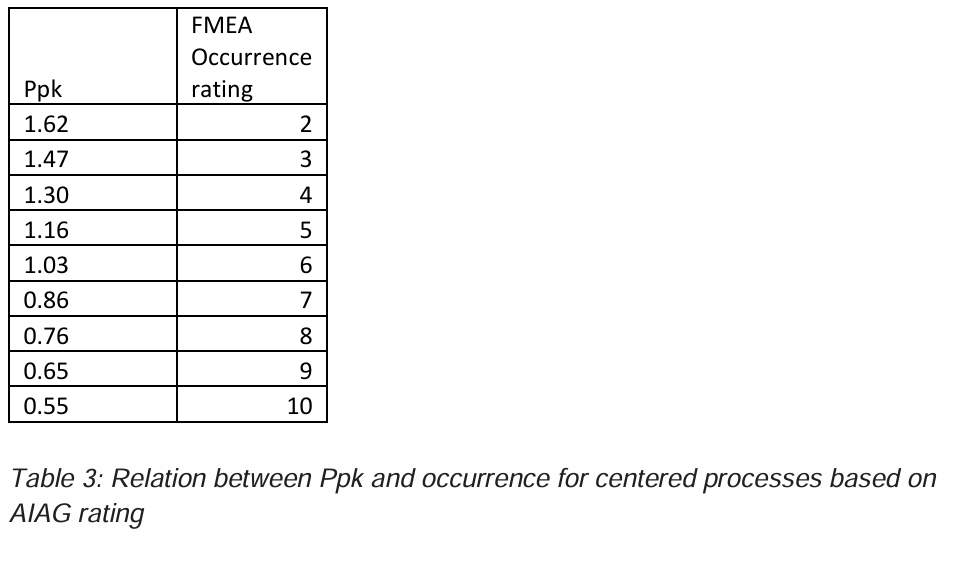
But the above is again a simplification of real life. First, when we look at predicted percentages out of specification, we must have a process which is in control otherwise the predicted percentage out of spec can be anything and the occurrence should be a 10.
Secondly, what time frame do we consider. For a reliable prediction you must take at least a hundred measurements, but if we have a very long-time frame, we could have more chances of out of controls. A good compromise is to use the last 125 measurements for this review.
The most complex item might be that there are many charts related to the same failure mode. For example, if we check the temperature of a drill head as an important control, then we will have a separate control chart for every machine, so instead of 1 predicted percentage out of spec we will have multiple. We could argue that we take an average of all machines, but a product is not made on an average machine, so it is better we use the worst machine and use that number for the occurrence verification.
To avoid many reviews we can add the occurrence rating to the control chart so if the ‘predicted percentage out’ exceeds the ‘benchmark percentage out’ an automatic alert will be sent to a responsible engineer and he needs to analyze the situation and possibly initiate adjustment of the occurrence rating in appropriate FMEAs.
Step 5. Update existing documents:
Basically, in all steps described above if discrepancies are found between the related current FMEA and real life all output and FMEA associated documents should be updated and possible corrective actions need to be added to improve the process. Like all other continuous improvement tools, a list of R FMEA actions and change records of SOD ratings pre and post R FMEA must be maintained, which can be done in DataLyzer FMEA.
Final Remark
In this Blog we hope we have provided you with an insight on how you can implement R FMEA as a continuous improvement process. Of course, in addition
there needs to be organizational steps to assign the tasks to the right people and you have to think and implement approval loops.
Feel free to reach out in case of additions or further questions.
Discover how DataLyzer can help you improving your continuous improvement process by implementing Reverse FMEA. Our team of experts is ready to show you how our solutions can be tailored to your specific production needs.

