50+ countries
Global use, local impact

47 years in business
Originated in 1979

50+ employees
Europe, USA and Asia

2000+ customers
More than 20.000 users
Blog: Link between AIAG-VDA Flow Chart, FMEA and Control Plan
Linking Process Flow, FMEA and Control Plan – Introduction
There is a logical order between the Process Flow Chart, FMEA and Control Plan, but if you don’t use the exact same steps and descriptions, it is difficult to maintain the logical relationship.
It is very time-consuming to maintain the correct relationship if Process Flow, FMEA and Control Plan are not automatically linked. This is an item auditors are very keen on, which means people are spending a lot of time before audits to align the three documents.
With the combined efforts of the AIAG and VDA a combined manual has been introduced in 2019, and with it automotive suppliers have faced an interesting new challenge. The differences with the AIAG 4th edition manual are so numerous that we might consider AIAG-VDA a completely new way to look at FMEAs. The whole structure moved towards a 7-step approach, forcing the user to consider all aspects that might influence the process or product in a structured manner. The underlaying thought is creating a robust process which will actually reduce risk as well as help prevent defects. We moved from using 20 columns to using 33. This makes a huge impact especially in the hierarchy of the FMEA documents. See below an example of an FMEA made in the AIAG 4th template.
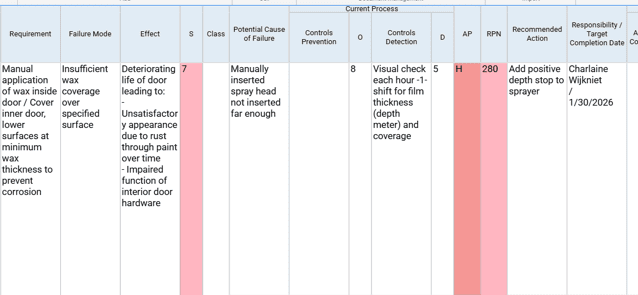
Figure 1: AIAG 4th edition example in Datalyzer FMEA
The harmonized AIAG-VDA manual requires the 7 steps to be incorporated into the FMEA process resulting in the extra columns, which takes some getting used to if you have been using the AIAG 4th format.
The columns for Step/ Function and Requirement need to be converted to 6 columns in the AIAG VDA template. While in Datalyzer FMEA we also use a column for Requirement ID, this is not a mandatory column in either AIAG 4th or AIAG VDA. We use this column to establish a link between FMEA and Control Plan. In the Control Plan manual, Characteristic Number is described as a number used to cross reference all applicable documents, including FMEA, Flow Charts, drawings etc. Below you will find an example of the AIAG VDA FMEA template.
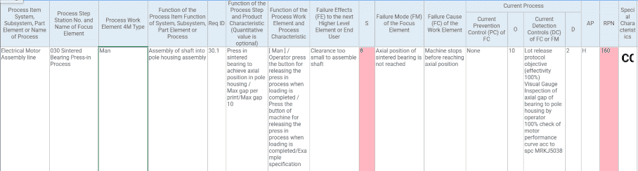
Figure 2: AIAG-VDA FMEA example in Datalyzer FMEA
In 2024, a new book for the Control Plan was released to better match to the AIAG-VDA FMEA guidelines. In the rest of this whitepaper we will discuss how we can link Flow Chart, FMEA and Control Plan based on the new manuals.
Process Flow Chart to FMEA
The first step as described in AIAG-VDA manual is to create the Process Flow Chart. In the Flow Chart we:
While a good Flow Chart costs a lot time (estimated 40-50% of your FMEA process) it will be a structured input for your FMEA. When we find the sequential order of our process, we have established it not only for the Flow Chart, but for the FMEA and Control Plan as well. The information we put in the Flow Chart is basically our structure analysis, with added symbols to identify the flow and the Incoming Variation.
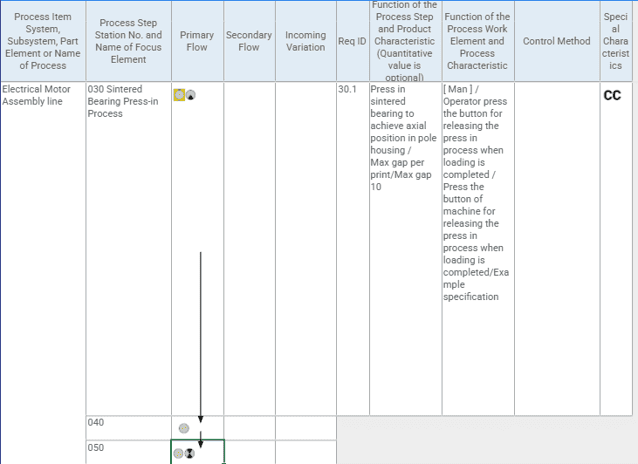
Figure 3: Example Flow Chart in Datalyzer FMEA
Keep in mind that in the AIAG-VDA form C the first column, Process Item System/ Subsystem/ Part element or Name of Process will likely be repeated throughout the entire FMEA. This column describes what we get after successfully following all the process steps. The next column lines out the step or station numbers and name of the focus element. When we have set out the sequential steps, and outlined the functions for each, we can move on to the FMEA. So, from this Flow Chart we get the following FMEA:
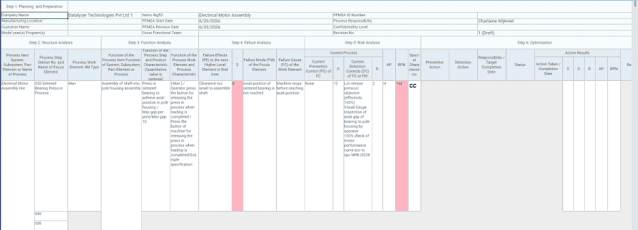
Figure 4: Example AIAG VDA FMEA in Datalyzer FMEA
In DataLyzer FMEA the Flow Chart and FMEA are sharing the columns for Process Item, Process Step, Functions and Characteristics. This means that whenever you add a step to the FMEA, it is automatically added to the Flow Chart as well and vice versa. This makes it impossible to deviate, and automatically ensures that documents are aligned. After finishing the structure analysis, you will continue with the function analysis, failure analysis, risk analysis and optimization.
The Function Analysis and part of the Risk Analysis steps are the most important inputs from the FMEA for the Control Plan after the Structure Analysis.
FMEA to Control Plan
Working with Datalyzer FMEA will allow you to create a linked Control Plan. This means we will link the Step column and the function to the Part/ Process Number and Operation description columns in the Control Plan. Whenever you update these columns in the FMEA, the Control Plan will automatically be updated as well. You can always recognize when something is linked by the different color.
Linking the FMEA and Control Plan means you can only add steps in the FMEA or Process Flow, which will automatically update the Control Plan as well. Looking at both documents in the software you will get the result as shown in figure 5. In the example you can see that we take the column for Process Step as well as the Function of the Process Step to the Control Plan.
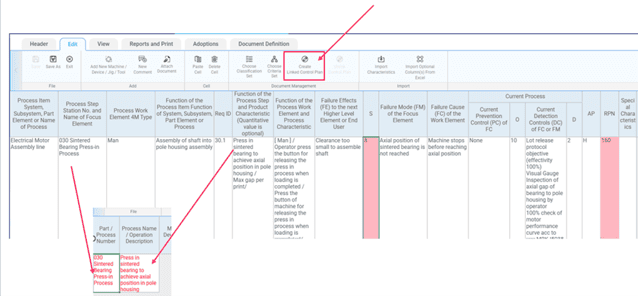
Figure 5: FMEA with linked Control Plan
While this is already a good first step in linking the documents, in Datalyzer FMEA we can go one step further. We can copy more information directly from the FMEA to the Control Plan. In the Function Analysis step we already think about the product and process characteristics. While it is not mandatory, the manual encourages to also enter the specifications when applicable and known. In Datalyzer FMEA you have an optional setup where you will find 3 spaces in the pop-up to enter this information as shown in figure 6. It is possible that you have reasons to leave some of the requirements out of the Control Plan, therefore you can also check the box ‘Do not copy to Control Plan’, if this information would not be needed in the Control Plan.
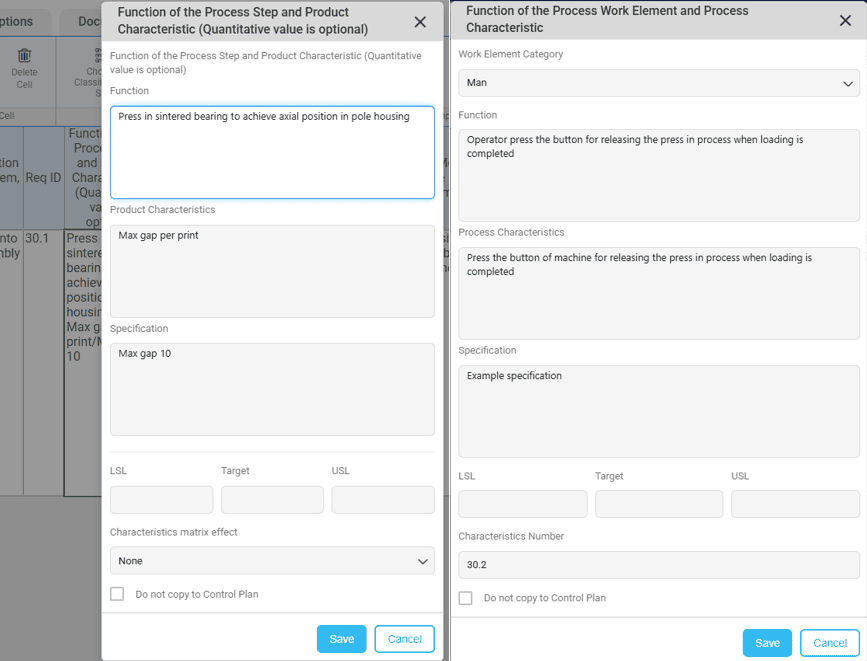
Figure 6: Data entry screen for Function of the Process Step and Product Characteristic and Function of the Process Work Element and Process Characteristic
According to the Control Plan manual Product Characteristics are the functions or features, described in the drawings of a part, component or assembly. All special characteristics must be listed on the Control Plan. Process Characteristics are process variables or input variables with a cause and effect relationship with the product characteristic. They are measured at the time they occur. There could be one or multiple process characteristics for every product characteristic listed. In some cases one process characteristic could affect several product characteristics.
The next bit of information that could be shared between the FMEA and Control Plan are the Prevention and Detection controls. In the Control Plan this translates to the Control Method. While in the software you can choose to not copy the controls to the Control Plan, it is recommended to take them. Because this information is copied, it can be edited after copying. After copying there will still be some cells that need to be filled out. So, if you want to add a machine number or a work instruction for example, you can add that to the corresponding cell in the Control Plan.
The Control Method is an important part of an effective control plan. Here we write a short description of how the operation will be controlled and managed. The control method chosen should be based on an effective analysis of the process. It is determined by the type of process and the risks identified during quality planning (e.g. FMEA). Operations may be controlled by, but are not limited to Poke Yoke, Statistical Process Control, (100%) inspection, Camera’s and sensors, etc.
Finally, we can copy the Special Characteristics from the FMEA to the Control Plan. It is important when copying the symbols between documents to make sure you are using the same set of symbols in both the FMEA and Control Plan. In the FMEA we should already have identified our critical characteristics, so they should have a classification symbol in the FMEA. This symbol can then be copied over to the Control Plan and automatically linked to the relevant product or process characteristic. If we copy all this information the links look like below figure.
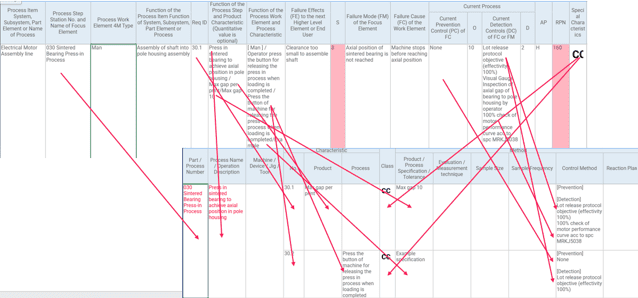
Figure 7: Link between FMEA and Control Plan columns
Taking the information from the FMEA will fill up your CP almost halfway. The software allows you to use Standard Text for any column, so you can quickly fill out the rest of the Control Plan. Especially for sample sizes and frequencies it is relatively easy to standardize your options in a dropdown menu. Or this information can be automatically entered when you import ballooning information directly into the Control Plan.
The Reaction Plan column is used to document and specify corrective actions on how to respond to defective products and preventive action to prevent them from reoccurring. Actions taken should be documented, and the actions should be the responsibility of the people closest to the process, the operator, job-setter or supervisor and be clearly designated in the plan. Reaction plans must include steps to contain suspect/ nonconforming products, stop the process from creating more suspect/ nonconforming products and the steps necessary to bring the process back in control prior to restart production.
Reaction Plan – Owner/ Responsible is a new column in the manual released in 2024. This column is linked to the reaction plan column, and the owner/ responsible is an individual responsible for all actions associated with the reaction plan.
When the Control Plan is done we can issue the document to create an official revision number, lock the dates and create a new draft version of the same document, to make sure we are using the documents as a living document. From here we can export the characteristics into Datalyzer SPC for SPC or directly print Inspection Plans from the software. While the Inspection Plans are the end of the scope of the FMEA software, Control Plan information can be exported to Datalyzer SPC to further enhance your continuous improvement
Conclusion
Aligning your documents is crucial for an effective process analysis. By copying and linking the information in the different forms you can save a lot of time and give your efficiency a boost. Most of the time will be spent outlining the scope of the analysis. Outlining the structure analysis for the Flow Chart, will organize the order of your Flow Chart, PFMEA and Control Plan. Connecting the Flow Chart, PFMEA and Control Plan will allow you to use the same column throughout the documents to establish an integrated link, which will automatically update the process in the Control Plan when updates to the process are made in the Flow Chart or FMEA. Specifying requirements and specifications in the PFMEA will help you guarantee the linkage between the documents by copying this information over to the Control Plan. Prevention and Detection methods used in the FMEA can be copied over to the Control Plan to ensure the linkage, as well as save you time in the creation time of your Control Plan.
9%
Cost Reduction Achieved by customers


What customers say
“Datalyzer helped us automatically link quality data from all processes for advanced analysis”
Dave Beeren
Yield Engineer, Philips
Industries we serve

ISO Certified
ISO 27001 & SOC2