50+ countries
Global use, local impact

47 years in business
Originated in 1979

50+ employees
Europe, USA and Asia

2000+ customers
More than 20.000 users
Blog: The changed calculation of Control Limits in the New VDA-AIAG SPC Manual: A Practical Implementation guide
About the author
Marc Schaeffers is Managing Director of Datalyzer and has more than 35 years of experience implementing Statistical Process Control (SPC) systems for manufacturers worldwide. He has supported organizations in the automotive, aerospace, high tech, food &beverage and medical industries with the implementation of advanced quality management and Industry 4.0 solutions.
Executive Summary
The 2026 VDA-AIAG SPC Manual introduces a new approach for calculating control limits by allowing users to select different confidence levels instead of relying solely on the traditional three-sigma method. This change reflects the reality that modern manufacturing collects vastly more data than when Statistical Process Control (SPC) was first developed.
While the new approach offers greater flexibility, it also introduces practical questions. How should confidence levels be selected? What are the trade-offs between detecting process changes and minimizing false alarms? And is changing the confidence level really the best way to improve SPC effectiveness?
This article explains the statistical concepts behind the new recommendations and discusses their practical implications based on Datalyzer’s experience implementing SPC systems in manufacturing environments worldwide. We conclude that the new confidence-level approach is a valuable addition to the SPC toolbox. However, successful implementation depends less on selecting different control limits and more on ensuring that operators receive meaningful, actionable alerts. For most organizations, intelligent alarm management will deliver greater benefits than simply changing the statistical calculations. In another blog we have discussed consequences of the newly defined capability indices.
This article is also published in Quality Digest
Key Takeaways
1. Introduction
With the publication of the new VDA AIAG SPC Manual in July 2026, one of the most significant changes to Statistical Process Control (SPC) in decades has been introduced. While much attention has been given to the new process capability indices, an equally important change is the introduction of a new approach for calculating control limits. For nearly a century, Shewhart’s three-sigma control limits have formed the foundation of SPC. They have proven to be remarkably effective and are still widely used across manufacturing industries today. So why does the new manual introduce an alternative approach?The manual recommends allowing organizations to select different confidence levels when calculating control limits. Although the manual explains how these limits can be calculated, it provides relatively little guidance on why this flexibility has been introduced or how it should be applied in practice. Based on our experience implementing SPC systems in manufacturing environments around the world, we believe the motivation is closely related to the dramatic increase in automated data collection. Modern factories generate far more data than Walter Shewhart could ever have imagined in 1931, creating practical challenges that traditional SPC was never designed to address.
This article first explains the statistical concepts introduced by the new manual and then discusses the practical considerations for implementing them in large-scale SPC systems.
2. The Origins of Three-Sigma Control Limits
The Origins of Three-Sigma Control Limits
Statistical Process Control was introduced by Walter A. Shewhart in his landmark 1931 publication Economic Control of Quality of Manufactured Product. His work established the principles that still form the basis of modern control charts. Shewhart’s choice of three standard deviations (3σ) for the control limits represented a practical compromise between detecting genuine process changes quickly while avoiding excessive false alarms. As Donald Wheeler has demonstrated in numerous publications, three-sigma control limits are remarkably robust and effective for stable manufacturing processes.
Manufacturing has changed
When Shewhart developed SPC, measurements were collected manually and relatively few process characteristics were monitored. Today, modern production systems continuously collect data from PLCs, vision systems, CMMs, automated gauging equipment and IoT devices. In many industries, SPC has evolved from monitoring a handful of characteristics to continuously analyzing millions of measurements every day.
The Challenge of False Alarms
Traditional three-sigma control charts have a confidence level of approximately 99.73%, meaning around 0.27% of stable subgroups are expected to exceed the control limits purely due to random variation. With thousands of charts, this results in a significant number of statistical signals every day, creating alarm fatigue and making it difficult for operators to identify genuinely important process changes.
Although the manual does not explicitly identify alarm overload as the motivation for introducing configurable confidence levels, it does emphasize that additional control-chart rules should only be applied when they serve a specific purpose.
What has changed
The new manual allows organizations to select different confidence levels when calculating control limits. This changes the constants used for control charts (e.g. A2, D3 and D4), allowing organizations to balance sensitivity against false alarms. This provides considerably more flexibility.
For example:
Conversely,
Neither approach is inherently better. Each represents a different balance between sensitivity and stability.
To understand these trade-offs, we first examine three statistical concepts: the false alarm rate, the Operating Characteristic (OC) curve and the Average Run Length (ARL).
3. Confidence level, OC curve and ARL
Understanding the trade-off
Selecting a confidence level affects three important performance characteristics of every control chart.
False alarm rate
The most obvious consequence is the false alarm rate. With traditional three-sigma limits, approximately 0.27% of stable subgroups are expected to exceed the control limits. Reducing the confidence level increases this percentage, while increasing the confidence level reduces it. From an operational perspective, this directly influences the workload placed on operators and engineers.
Operating characteristic curve
A less familiar—but equally important—concept is the Operating Characteristic (OC) Curve. The OC curve shows the probability that a particular process shift will be detected by the control chart. Small process shifts are difficult to detect because they are difficult to distinguish from normal process variation. As the size of the process shift increases, the probability of detection also increases.
Figure 1 compares OC curves for two different confidence levels. The figures illustrate an important principle. Reducing the confidence level increases the likelihood of detecting small process shifts, but this improved sensitivity comes at the expense of more frequent false alarms. Conversely, increasing the confidence level reduces unnecessary alerts but delays detection of genuine process changes.
It should be noted that these OC curves consider only violations of the control limits. Additional Western Electric or Nelson rules will further influence the actual detection performance.
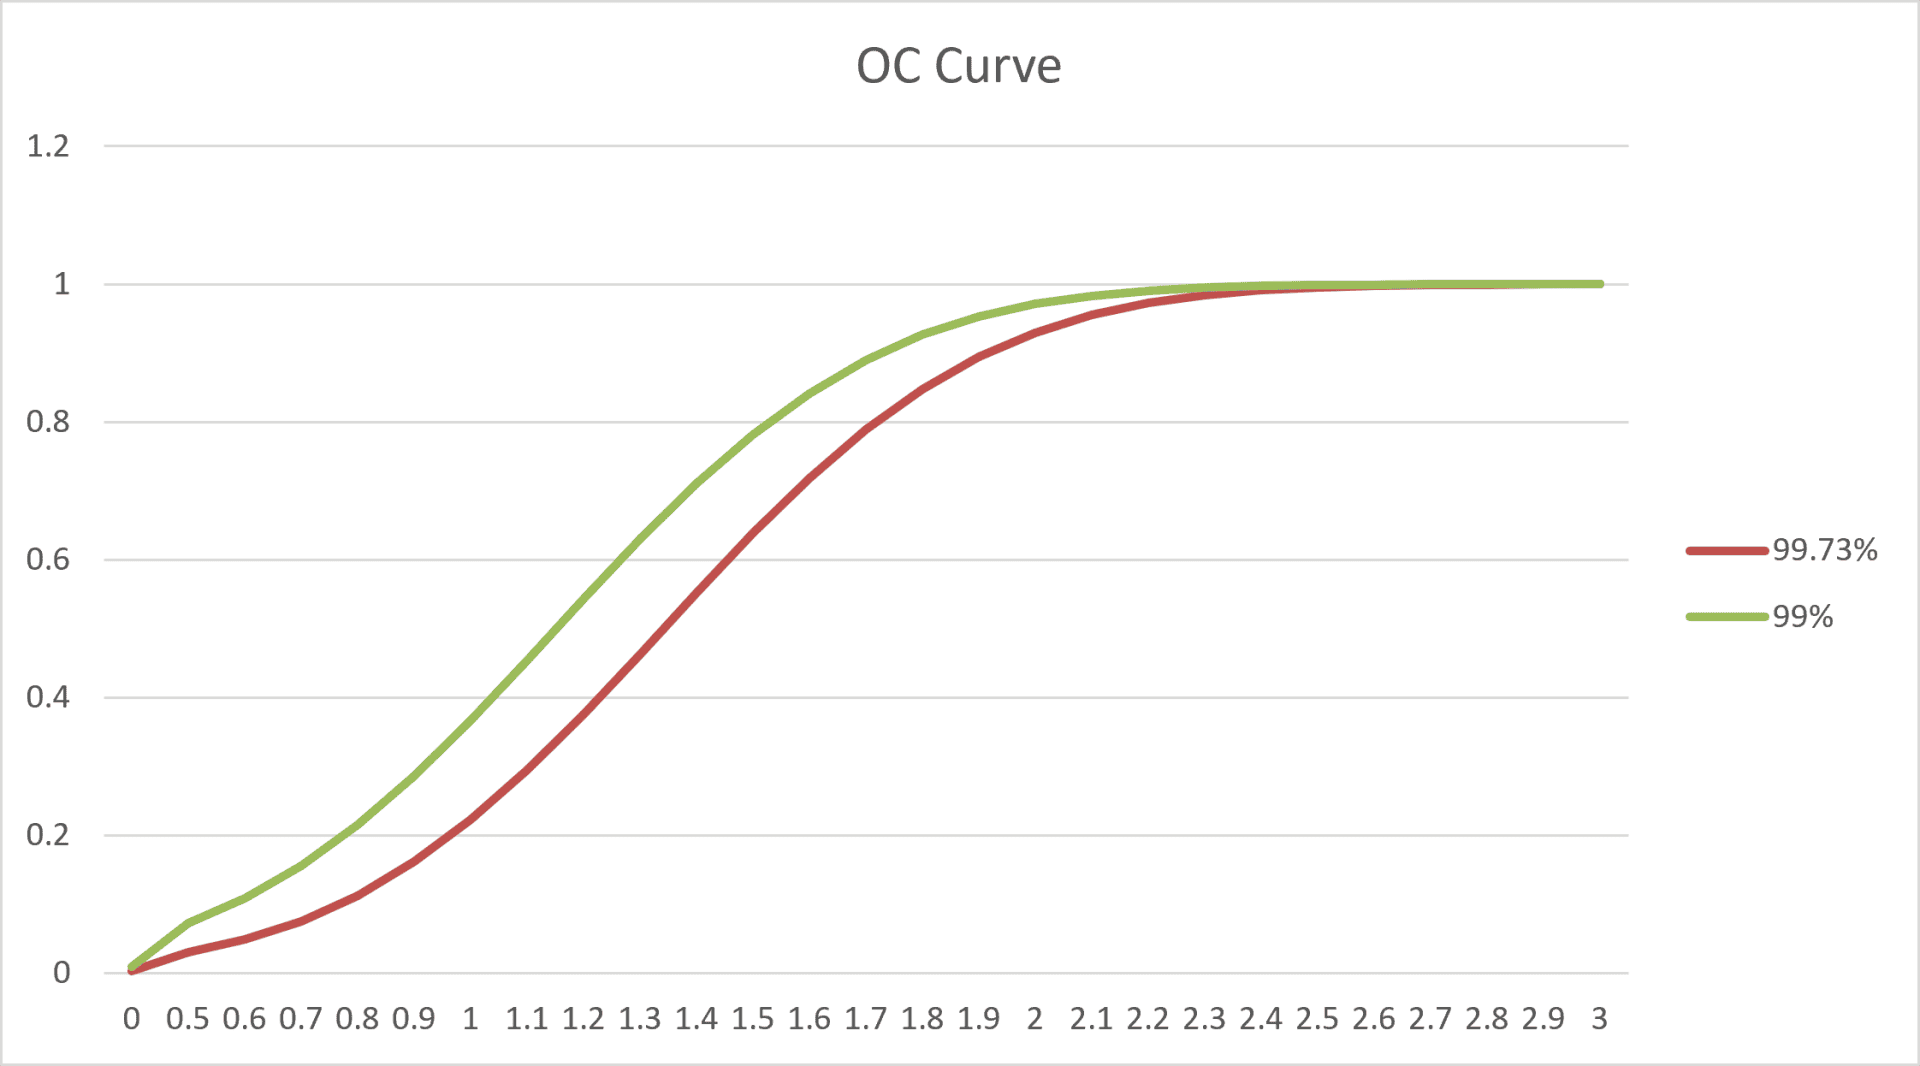
Figure 1: Chance of alert on control chart with confidence level of 99% and 99.73%
Average run length
Another useful measure is the Average Run Length (ARL). ARL represents the average number of subgroups that will be collected before a process shift is detected. Lower confidence levels generally reduce the ARL because shifts are detected sooner. Higher confidence levels increase the ARL because larger shifts are required before the control chart signals.
For organizations producing large volumes of product, this difference can have a significant impact on the amount of nonconforming material produced before corrective action is taken.
Comparing Different Confidence Levels
To illustrate these trade-offs, Table 1 compares three commonly discussed confidence levels for an X̄-R chart with a subgroup size of five.
| % change detecting sigma change | ARL | ||||||
| A2 | D4 | % False alarms | 0.5 sigma | 1 sigma | 2 sigma | 1 sigma | |
| 99% | 0.5 | 1.96 | 1% | 7.30% | 36.70% | 97.10% | 2.7 |
| 99.73% (AIAG) | 0.58 | 2.11 | 0.27% | 3% | 22.20% | 92.30% | 4.5 |
| 99.99% | 0.75 | 2.45 | 0.01% | 0.30% | 4.90% | 72.00% | 20.4 |
Table 1: Results for different confidence levels based on a XR chart with n=5
Several observations can immediately be made. A confidence level of 99% substantially increases the probability of detecting small process shifts. However, this comes with a corresponding increase in false alarms. At the opposite extreme, a confidence level of 99.99% dramatically reduces false alarms but significantly decreases the chart’s ability to detect meaningful process changes in a timely manner. The traditional 99.73% confidence level remains a well-balanced compromise between these two extremes.
Interestingly, the examples provided in the new VDA AIAG manual focus primarily on confidence levels of 99% and 99.73%, suggesting that the authors expect users to consider somewhat tighter limits where appropriate rather than universally widening control limits.
Changing the confidence level is not a way to improve process capability.
It only changes how sensitive the control chart is to process variation. A wider control limit reduces false alarms but also delays the detection of genuine process changes. Manufacturers should therefore select confidence levels based on operational requirements rather than expecting improved process performance.
4. Practical Implementation Considerations
In our previous chapters, we explained the statistical background behind the new VDA AIAG SPC Manual and discussed why the manual introduces the option of selecting different confidence levels for calculating control limits. While understanding the statistical concepts is important, implementing these recommendations in a production environment presents a very different challenge. Selecting a confidence level for a single control chart is relatively straightforward. Applying the same approach consistently across hundreds—or even thousands—of control charts is considerably more complex.
Based on our experience implementing SPC systems in manufacturing facilities worldwide, we believe the biggest challenge is not calculating new control limits. The real challenge is ensuring that SPC remains an effective tool for operators and engineers without overwhelming them with unnecessary alerts. This chapter discusses the practical considerations for implementing the new recommendations and provides our advice for organizations looking to adopt the new VDA AIAG approach.
Flexibility Comes at a Cost
One of the strengths of the new manual is that it no longer assumes a single confidence level is appropriate for every situation. From a statistical perspective, this makes perfect sense. Different processes have different objectives and different levels of risk. From an implementation perspective, however, this flexibility introduces additional complexity.
Consider a company with 5,000 control charts. If every characteristic can have its own confidence level, someone must decide:
- Which confidence level should be used?
- Who is responsible for making that decision?
- How will these decisions be documented?
- How will consistency be maintained across production lines and plants?
- What happens when customer requirements change?
Although selecting a confidence level for a single chart is easy, maintaining different settings across thousands of characteristics can quickly become a significant engineering and administrative effort. For this reason alone, we expect that many manufacturers will continue to use a common default confidence level for most of their control charts.
Dynamic Versus Fixed Control Limits
The new confidence level approach can be used with either dynamically calculated control limits or fixed control limits established during an initial process capability study. Both approaches have advantages.
Dynamic limits automatically adapt as the process changes. They require little maintenance and always reflect the current process variation.
However, there is also an important disadvantage. When a process slowly drifts over time, dynamically calculated limits may gradually move with the process. As a result, a genuine deterioration in process performance may not immediately produce an out-of-control signal because the limits themselves are changing. For critical characteristics, this is often undesirable.
In our experience, safety characteristics, regulatory characteristics and customer-critical dimensions are usually better monitored using fixed control limits established from a stable process. These limits provide a consistent reference against which future performance can be evaluated.
Dynamic limits remain valuable during process development or when establishing an initial baseline, but they should not automatically be considered the best choice for every application.
Does Every Characteristic Need Its Own Confidence Level?
The new manual makes different confidence levels possible. It does not necessarily mean they should be used everywhere. Some characteristics clearly justify greater sensitivity. Examples include safety-related dimensions, characteristics with a history of instability or processes where very small shifts have significant consequences. Other characteristics may be less critical and could tolerate wider control limits without increasing business risk.
While this approach is statistically sound, implementing it consistently requires detailed engineering knowledge for every monitored characteristic. For organizations managing thousands of SPC charts, this quickly becomes difficult to maintain. Consequently, we expect many manufacturers to adopt a practical compromise:
This approach captures most of the benefits while avoiding unnecessary complexity.
The Real Challenge: Alarm Fatigue
In our opinion, the biggest challenge facing modern SPC systems is not the calculation of control limits. It is alarm management. Today’s manufacturing systems generate far more data than traditional SPC was designed to handle. Even when control limits are calculated correctly, operators may still receive far more alerts than they can reasonably investigate. Eventually two things happen.
First, operators become accustomed to frequent alarms and begin to ignore them. Second, truly important process changes become hidden among numerous routine statistical signals. Neither outcome improves quality. For SPC to remain effective, operators must have confidence that when an alarm occurs, it deserves their attention.
A Different Way to Reduce Unnecessary Alerts
One obvious way to reduce alarms is to increase the confidence level, thereby widening the control limits. While this reduces false alarms, it also delays the detection of genuine process changes. In our experience, there is often a better solution. Instead of asking whether a point falls outside the control limits, we should also ask whether the process itself is capable.
A process with a Ppk value of 12 is operating far inside its specification limits. Although an individual subgroup may occasionally fall outside the statistical control limits, the risk of producing nonconforming products remains extremely small. In contrast, exactly the same statistical signal on a process with a Ppk value close to 1.33 deserves immediate investigation. Although both charts generate identical SPC signals, the operational response should not necessarily be the same. This illustrates an important principle. Not every statistical signal requires the same operational response.
Intelligent Alert Management
Within Datalyzer Qualis we have addressed this challenge by allowing alerts to be prioritized based on process capability.
For example, alerts requiring operator action can be suppressed automatically when the Ppk value exceeds a configurable threshold. This does not ignore the statistical information. The control chart still records every point and every rule violation. The difference is that operators are only interrupted when the signal represents a meaningful operational risk. Engineering personnel remain able to review all SPC information, while production operators can focus their attention on where it creates the greatest value.
In our experience, this approach produces a much larger reduction in unnecessary operator interventions than simply changing confidence levels.
Our Recommendations
Based on our implementation experience, we recommend the following approach when adopting the new VDA AIAG SPC Manual.
1. Unless there is a clear engineering reason to do otherwise, use the traditional 99.73% confidence level as the organizational default.
It remains an excellent compromise between sensitivity and false alarms and avoids unnecessary configuration complexity.
2. Only use alternative confidence levels where there is a clear engineering justification.
Examples include safety-critical characteristics, customer-specific requirements or specialized process monitoring.
3. Consider fixed control limits for critical characteristics.
Fixed limits provide a stable reference and make gradual process deterioration easier to detect.
4. Focus on alarm management rather than simply changing control limits.
Reducing unnecessary operator interventions often delivers greater benefits than modifying the statistical calculations themselves.
5. Prioritize alerts according to process capability.
A capable process and a marginal process should not necessarily generate the same operational response, even when they produce identical SPC signals.
5. Conclusions
The new VDA AIAG SPC Manual introduces valuable flexibility by allowing manufacturers to select different confidence levels for calculating control limits. From a statistical perspective, this is an important evolution. However, successful implementation requires more than selecting a different confidence level. Organizations must also consider the practical realities of operating modern SPC systems that monitor thousands of process characteristics simultaneously.
In our experience, the greatest improvements come not from changing the mathematics behind the control limits, but from ensuring that operators receive meaningful, actionable information. A well-designed SPC system should help operators focus on the few process changes that truly matter—not overwhelm them with statistical signals that add little operational value.
Ultimately, the objective of SPC has not changed since Shewhart introduced it almost a century ago: to detect meaningful process variation early enough to take effective corrective action. The new VDA AIAG recommendations provide additional flexibility to achieve that objective, but they should always be implemented within a broader strategy for effective process monitoring and intelligent alarm management.
Nearly one hundred years after Shewhart introduced SPC, the mathematics may have evolved, but the objective remains exactly the same: provide the right information to the right people at the right time so that meaningful process variation can be eliminated before it affects product quality.
This article reflects the authors’ interpretation and implementation experience with the AIAG & VDA SPC Manual. It is intended as practical guidance and does not replace the official manual.
Are you preparing for the new AIAG & VDA SPC Manual? Contact Datalyzer to discuss how your current SPC implementation can be aligned with the new recommendations or subscribe for free webinar where consequences will be discussed.
9%
Cost Reduction Achieved by customers


What customers say
“Datalyzer helped us automatically link quality data from all processes for advanced analysis”
Dave Beeren
Yield Engineer, Philips
Industries we serve

ISO Certified
ISO 27001 & SOC2