50+ countries
Global use, local impact

47 years in business
Originated in 1979

50+ employees
Europe, USA and Asia

2000+ customers
More than 20.000 users
Measurement System Analysis for Attribute Data: Cohen’s Kappa
Introduction
Measurement System Analysis (MSA) studies are well known nowadays in industry. But when we talk about MSA studies we are mostly referring to Gage Repeatability and Reproducability (R&R) studies. However, during inspection we still often rely on visual inspection, although we know that visual inspection is not a reliable method to inspect quality.
For example In FMEA we must score detection at least with a 6 (moderate) out of 10 if attribute MSA studies are done with good results but more often it is a 7 or 8 (low detection rate).
During MSA training sessions we have done hundreds of experiments where people have to count a specific letter in a piece of text.This quick test under time pressure (only 10 to 15 seconds allowed) showed proof that appraisars were capable to find the right number of letters in a simple text. In this experiment scenario, there is no confusion about ‘what is a defect and what not’ and the appraisers were not tired. Still most appraisers did not came to the right conclusion. Exceptions were people from the printing industry who are highly experienced in visual inspection and scored significantly better on this test.
If a supplier claims they don’t deliver defects because they do 100% visual inspection, the first question should be: What is your defect rate found? From experience it is safe to say that at least 20% of the defect rate found will be delivered to customers.
A better idea about the risk can be established if an attribute MSA study is done. In this blog we will describe how an attribute study can be performed using Datalyzer Qualis Gage management software and what you need to consider setting up a study.
Setting up the Study
The most important part of an attribute study is setting up and organizing how the study should be done. Typically, in an attribute study you must have between 20 and 80 products in the study. First discussion is how do you establish what a good or bad product is. With an attribute gage you can measure the product with a variable master gage but with visual inspection that is not possible.
You need an “expert” team to establish what is a good product and what is a bad product. When you pick 50 products which are clearly good or bad then results will always be great. If you pick 50 products which are debatable even between experts than you can expect the study results to be always bad. It is important you need to pick a good set of products where maybe only a few products are debatable.
A visual inspection can be about a lot of items. In the scope of the study you need to determine if you combine multiple defects or you only use one specific defect in the study. Normally a study should be representative, so it is preferred you have multiple defects in the study. And the study should be done under similar circumstances as in production.
For example: a customer performed visual inspection of syringes on a machine with specific back light at a high speed. In that case you cannot offer the appraisers a set of syringes in an office and ask them to inspect them because that is not representative.
What we did in that case is we marked the syringes with a fluorescent marker and included the test syringes during normal inspection and filtered the syringes after the inspection. When you perform a study try to perform the study under the same circumstances and especially within the same time as the appraiser normally has.
Establishing a proper test set of products takes time. The problem is when you conduct this study on a regular basis you need to make sure study results will not be well known in the company. If you provide feedback what an appraiser exactly missed the next appraiser knowsexactly what to look for in a study which makes your test set worthless. A study must be done completely blind so make sure the identification of the product is not clear for the appraiser.
Last item is that you might need to “recalibrate” the test sample after a study. A product might get damaged or get dirty during a study and a product rated as ‘Good’ might be correctly rated by appraisers as ‘Bad’ because it got damaged or dirty during the study. This is especiallyapplicable if you have a higher number of false alarms than you expect.
Recording and Analyzing the Results
The method below is according to AIAG MSA manual 4th edition. Typically, 3 appraisers inspected the 50 products 3 times. The products will be inspected in an arbitrary order. For each product we enter the reference value which is 0 for reject and 1 for a good product.
So, for each product we get 9 inspection results. If all inspection results are a reject and agree with the reference value, we get a – sign in the code column. If all are an accepted product and agree with the reference value, you get a + sign in the code column. If there is any measurement different from the reference value, we see an X in the code column. In te bottom of the sheet we see the number of accepts and rejects per appraiser.
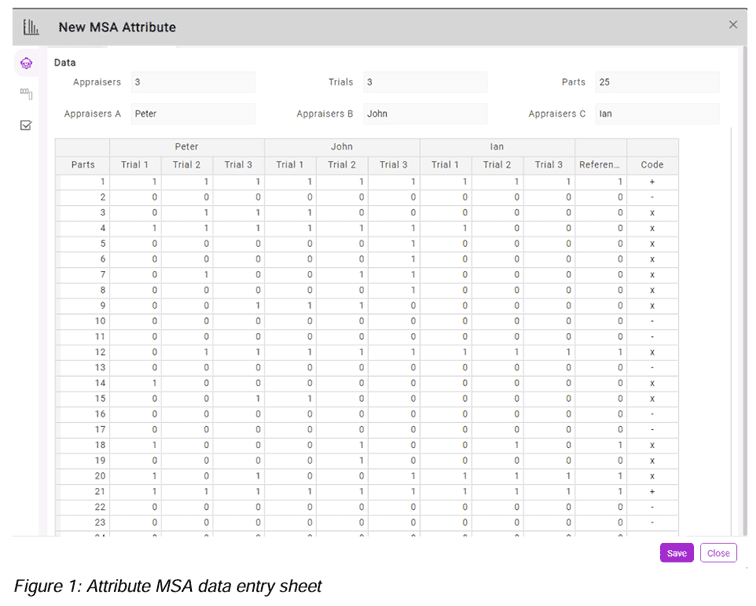
In the next step we compare how the appraisers agree with each other and with the reference value. We do that by making cross reference tables.
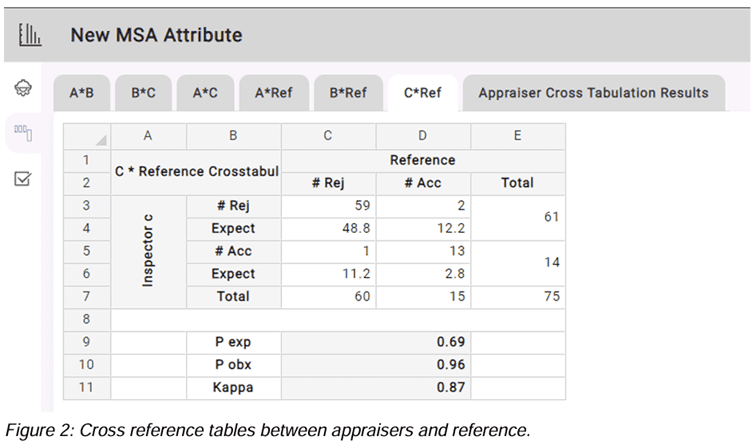
For each table we calculate the Cohen’s Kappa which is (p observed – p expected) / (1-p expected). This basically calculates the amount of agreement if we exclude the agreement by chance. The kappa result is rated good if kappa is higher than 0.75, marginal between 0.4 and 0.75 and bad below 0.4.
All Kappa values are higher than 0.75 so from this test it appears there is agreement between appraisers and between appraisers and the reference value. There is another test to confirm this. We can calculate the effectiveness of the appraiser by taking the number of correct decisions/ total opportunities for a decision. For each effectiveness we calculate the confidence interval (see figure 3). In this case each effectiveness value falls in the confidence interval of other appraisers meaning a confirmation of the hypothesis that the appraisers score the same.
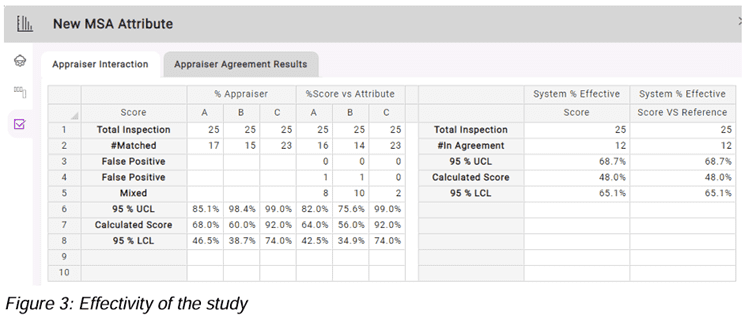
A miss is worse than a false alarm. In the last step we calculate the false alarm rate and the miss rate. In figure 4 you see the false alarm rate and the miss rate of the study.
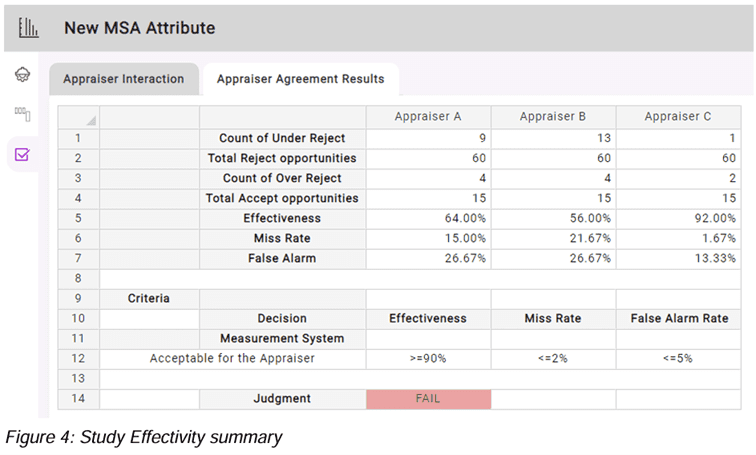
The criteria shown above are taken from the AIAG MSA manual. But is clearly stated that there is no theory-based decision and that this table is based on individual believes. So, you need to establish what is acceptable in your situation.
The table might even be confusing. You can have a miss rate of 3% and a false alarm rate of 6% both indicating the study is marginal, but the effectiveness is good in that case.
Based on the FMEA risk and customer requirements the criteria need to be established. It can even mean that you can have different criteria for different MSA studies, or the criteria can change over time. The result and the underlying analysis will give you guidelines how to improve visual inspection to an acceptable level.
9%
Cost Reduction Achieved by customers


What customers say
“Datalyzer helped us automatically link quality data from all processes for advanced analysis”
Dave Beeren
Yield Engineer, Philips
Industries we serve

ISO Certified
ISO 27001 & SOC2