50+ countries
Global use, local impact

47 years in business
Originated in 1979

50+ employees
Europe, USA and Asia

2000+ customers
More than 20.000 users
Process Capabilities explained: Cp, Cpk, Pp and Ppk
Introduction
An important part of any SPC implementation is the use of Process Capability Indices. These Indices are key KPIs to quantify how well your processes are capable of meeting specifications. There are several capability indices: Cp, Cpk, Ppk, Cpm, NCpk. In this Blog post we will discuss the most common used indices Cp, Cpk, Pp and Ppk. There is quite some confusion about the use of these indices. In this Blog we will try and remove some of the confusion and explain the differences between the indices and how they can be used in a practical way.
Definition of Capabilities
It is important to know that the definitions of the Capability Indices have been changed through history. Ppk was introduced as key index with the Q101 system of Ford as the preliminary capability index and the Cpk was defined as the long term capability index. In some cases the Cpk value of the Histogram was calculated differently from the Cpk calculations of the Control Chart. When the big three (Ford , GM and Chrysler) merged their quality manuals into the QS9000 system, the definitions were changed and these definitions are still the standard nowadays in the Automotive IATF16949 manual. More and more Industries are working with these similar Process Capability Indices like for example Aerospace Industry with their RM13006 manual.
CP: Process Capability
Cp (sometimes also named Cpi) stands for the capability index of the process. The Cp value reports the capability of the process within subgroups (‘short term capability’ or within subgroup capability). It reports the ‘precision’ of machine/process, not the location of the process. The formula for the calculation is:
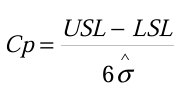
The σˆ refers to the estimated standard deviation. The estimated standard deviation is calculated using the following formula:
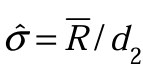
Where the average range of subgroups is divided by d2 which is taken from a statistics table.
This means the Cp index is calculated based on the within subgroup variation. So if the variation within the subgroup is very small you will have a good Cp index no matter how much the process average is drifting or what the location of the process is. The Cp index shows you how capable your machine is to produce consecutive products within the required variation (Tolerance).
Cpk
Because the Cp index alone doesn’t indicate if you are producing within specifications we need an indication whether the process is centered between the specification limits or not. Therefore the Cpk index is used. The formula is:
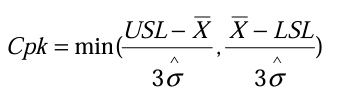
So if the process is exactly in the middle of LSL and USL the Cp and Cpk index are the same. If we now report both Cp and Cpk index we know how capable the process is to produce within the required variation (tolerance) and if the process is producing in the middle of the tolerance.
Pp (Process Performance)
Will the Cp and Cpk indices tell you whether or not your process is running within specification? The answer is no, because these two indices are calculated based on the ‘within subgroup variation’ and it is still possible there is a large amount of ‘between subgroup variation’ which is not taken into account. Let’s look at the below example.
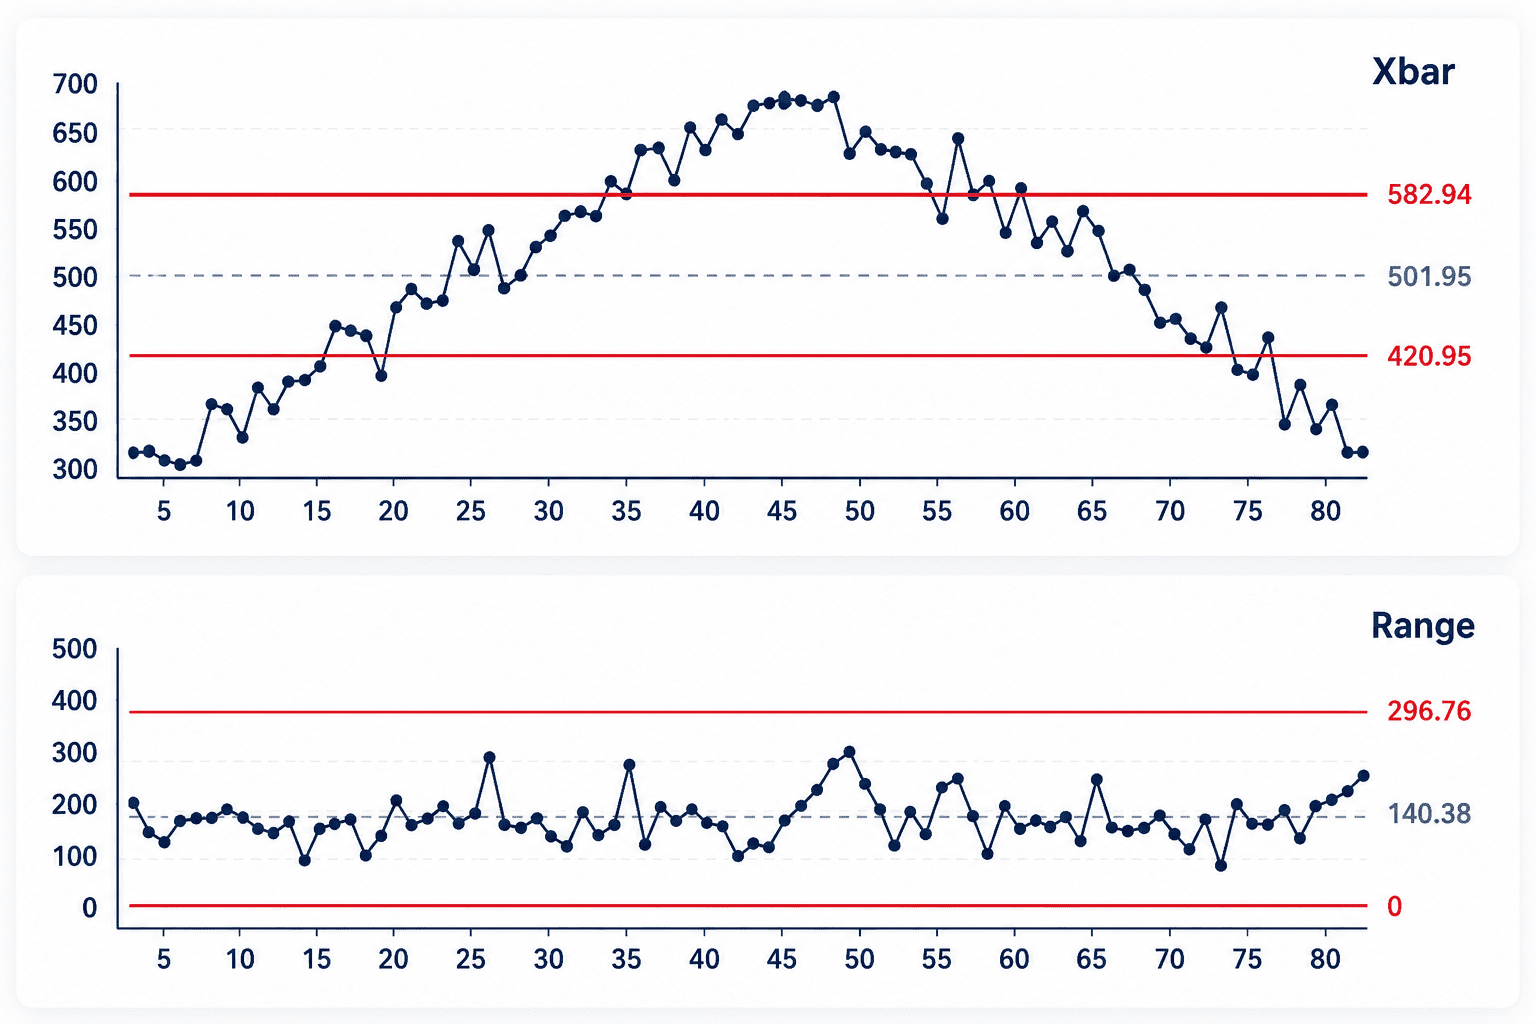
The Control Chart in above figure shows a process where we had a lot of variation between subgroups (Xbar chart) but the variation with the subgroup was in control (Range chart) The Cp index for this process is 1.64 and the Cpk index for this process is 1.62 which indicate that the process is capable to produce within the required variation and over the reported time period this process is in the middle of the tolerance. We see that these 2 indices are not enough and we need more information to know if the process is producing within specification limits. If we only use Cp and Cpk we need to add the requirement that the process must be in control. If the average chart is in control it indicates the process is stable and the process average is not fluctuating.
However we don’t always have the chart available when analyzing process data for example if we report a large number of characteristics. In that case we could indicate the percentage of subgroups out of control but there is also another possibility. We can also know if the process is stable by calculating the Process Performance Index Pp. The Pp index is calculated in the same way as the Cp index but now using the real standard deviation instead of the estimated standard deviation. So the formula is:
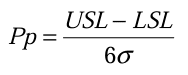
So the Pp index uses both within subgroup variation and between subgroup variation in the calculation and indicates how well the process was capable to produce within specification limits over the reported time period.
The Ppk index is calculated in a similar way as the Cpk index and accounts for the overall variation of all measurements taken, over more production runs.The Ppk value reports on all individual measurement values. The formula is the same as for Cpk but now the real standard deviation is used.
Practical Use of Capability Indices
If we now report 3 indices eg Cp, Cpk and Ppk we know what is happening in the process.

The requirement within most industries is that the Ppk value should exceed 1.67. If the Ppk value is below 1.67 the combination of Cp, Cpk and Ppk will give you an indication who is responsible to improve the capability. Let’s review below three processes:
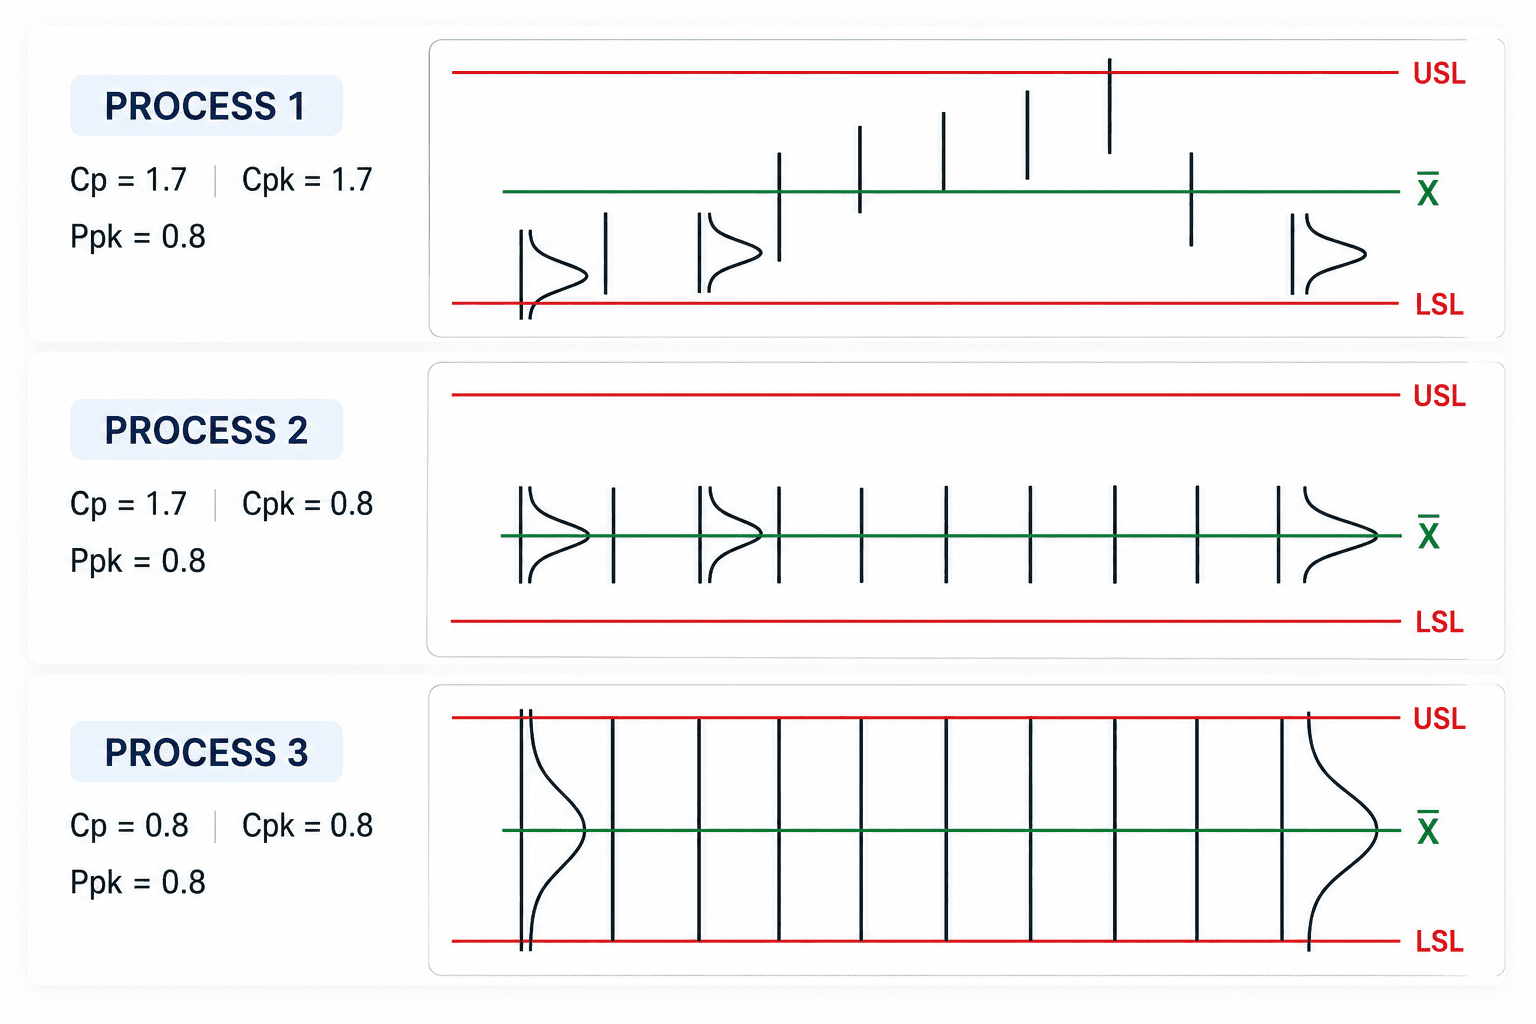
All three processes have the same Ppk index of 0.8 but require a completely different approach to improve capability and likely also a different department will be responsible to improve the capability.
Process 1: This process is out of control and has assignable causes. Where possible, the process must be brought in control and the primary responsible is the production team/ operators.
Process 2: This process has a wrong process setting and if the process is brought on target the Ppk will be acceptable. Primary responsible to bring this process on target is the production team/ operators.
Process 3: This process is not capable to produce consecutive products within the allowed tolerance so this process needs to be altered. The primary responsible to improve this process is the engineering team.
Conclusion
This blog should give you some better information on the use of the capability indices Cp, Cpk, Pp and Ppk and the power to use them together to get insight what is going on in the process. Some specific areas and complications of capability indices are deliberately left out of this blog to keep matters clear for SPC novices. When applying this in practice you will encounter special situations which require a little more insight. For example; what is the Pp value if you only have one specification limit? Or what is the Ppk value if you have a lower limit of 0 (eg perpendicularity) and you cannot have values below 0?
For a training on this subject please look at the free capability training on our Youtube Channel.
Datalyzer offers two software solutions where the capabilities are calculated as explained in this blog. The real time webbased Qualis SPC system or the webbased Qualis Analytics module. For further details please contact Datalyzer.
9%
Cost Reduction Achieved by customers


What customers say
“Datalyzer helped us automatically link quality data from all processes for advanced analysis”
Dave Beeren
Yield Engineer, Philips
Industries we serve

ISO Certified
ISO 27001 & SOC2