50+ countries
Global use, local impact

47 years in business
Originated in 1979

50+ employees
Europe, USA and Asia

2000+ customers
More than 20.000 users
Parallel Processes and Statistical Process Control
Introduction
Statistical Process Control (SPC) proves it value in many different Industries and types of processes. One interesting and challenging implementation of Statistical Process Control is when it is applied for parallel processes. There are many examples within production where parallel processes are found:

The SPC theory is quite clear: If you have a different process with different variation you should make separate control charts for each separate process. In practice however this is not so easy. For example with injection moulding of preforms the number of cavities can be 96 or even more. If you would measure 2 or 3 dimensions it would mean you have 192 control charts with 2 dimensions for just 1 mould. So there must be alternatives to define a sampling plan and still be able to find differences between parallel processes. The way to implement SPC and setup your control charts is highly depending on the type of variation which is found in the process.
Variation and Parallel Processes
In parallel processes there are typically 3 types of variation that can be considered. In figure 1 an example is given of 4 parallel processes where batteries or cans are produced and you want to measure a dimension of the products.
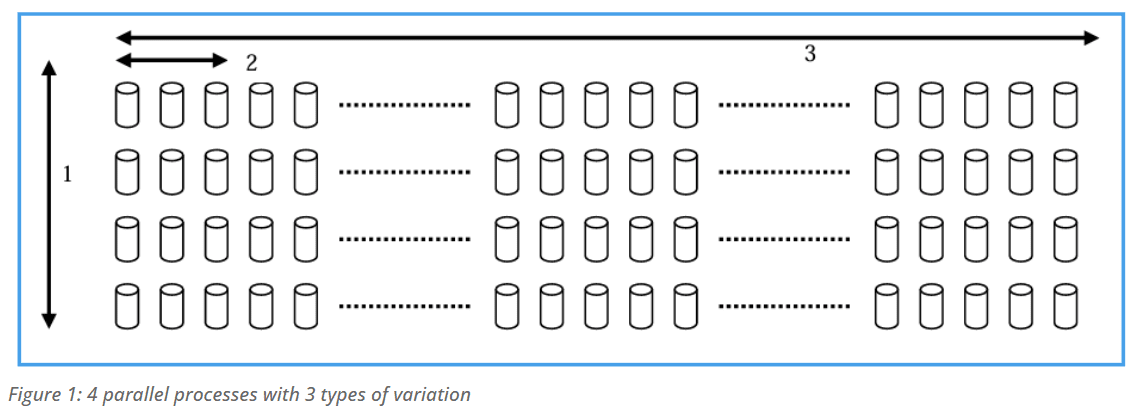
The 3 types of variation in this example are:

The best way to analyze the data is to make a control chart per process with a subgroupsize of for example 3. This means in one control chart you see the variation between cycles as the within subgroup variation. The variation over time is the between subgroup variation. The variation between processes can be analyzed by comparing results like Cpk and Ppk for different charts (as explained later in this blog).
In a lot of cases making the analysis like this is not economically feasible so in most of these cases the subgroups are taken across parallel processes. Taking subgroups across processes also makes sense if the cycle-to-cycle variation is small compared to the 2 other types of variation. Applying the second method can also be chosen after a certain amount of time when the process is completely in control and all special causes of variation are eliminated.
If you take subgroups across parallel processes then typically the range chart is showing the variation between processes and the control chart is showing the variation in time. Cycle-to-cycle variation is missing and also Cpk and Ppk values are representing other results than you normally would have if you combine consecutive products in a subgroup. And, if you decide to implement SPC using this method, you still want to be able to analyze the variation for one specific process. DataLyzer SPC is capable of implementing this method and to make the right analysis.
In practice you can also use a combination of the above described methods by using separate charts in case you have Out of Controls on the range chart. However, the combination of methods is typically not making it easier for operators in practice.
Comparing multiple Control Charts for the same characteristic of Parallel Processes
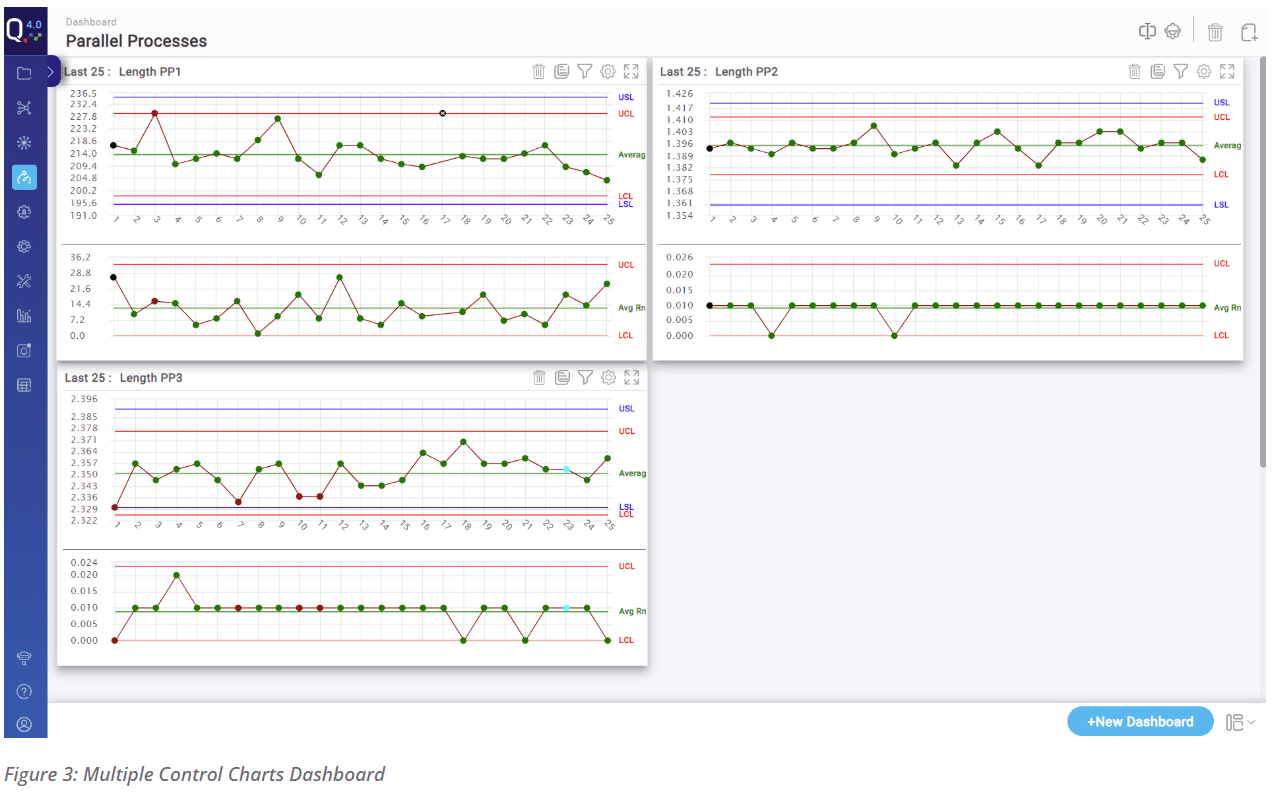
In DataLyzer Qualis SPC software there are several tools to compare data of different characteristics/ processes:
The methods in DataLyzer SPC software gives the engineer more then enough possibilities to compare processes. If it is important to monitor the average of different parallel processes an extra chart can be easily created which simply calculates the average of the other charts.
Comparing Parallel Processes within a Subgroup
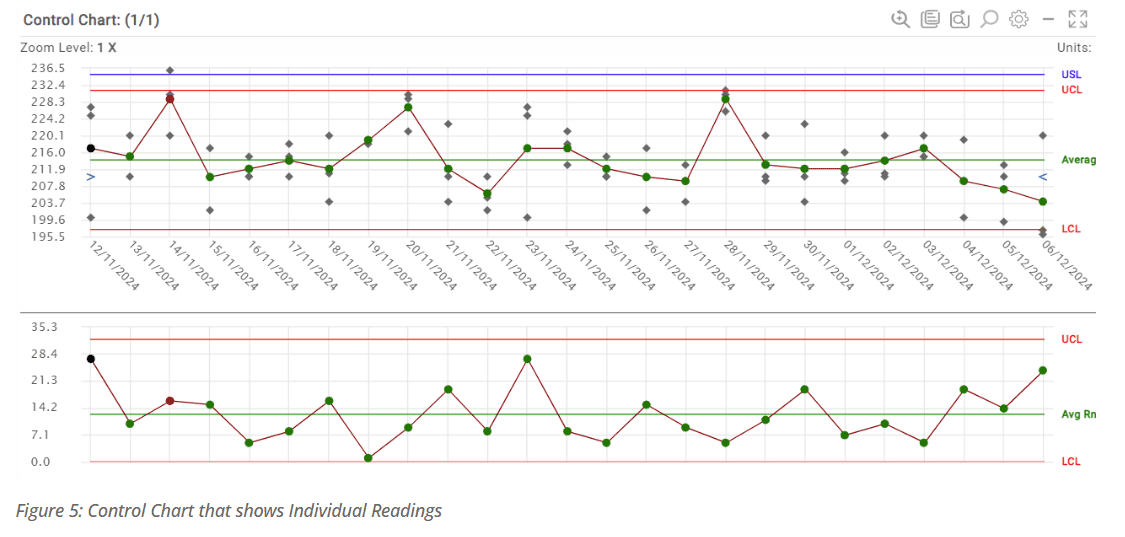
Datalyzer Qualis SPC has several features available to show the variation between parallel processes if they are combined within one Control Chart / Subgroup, like:
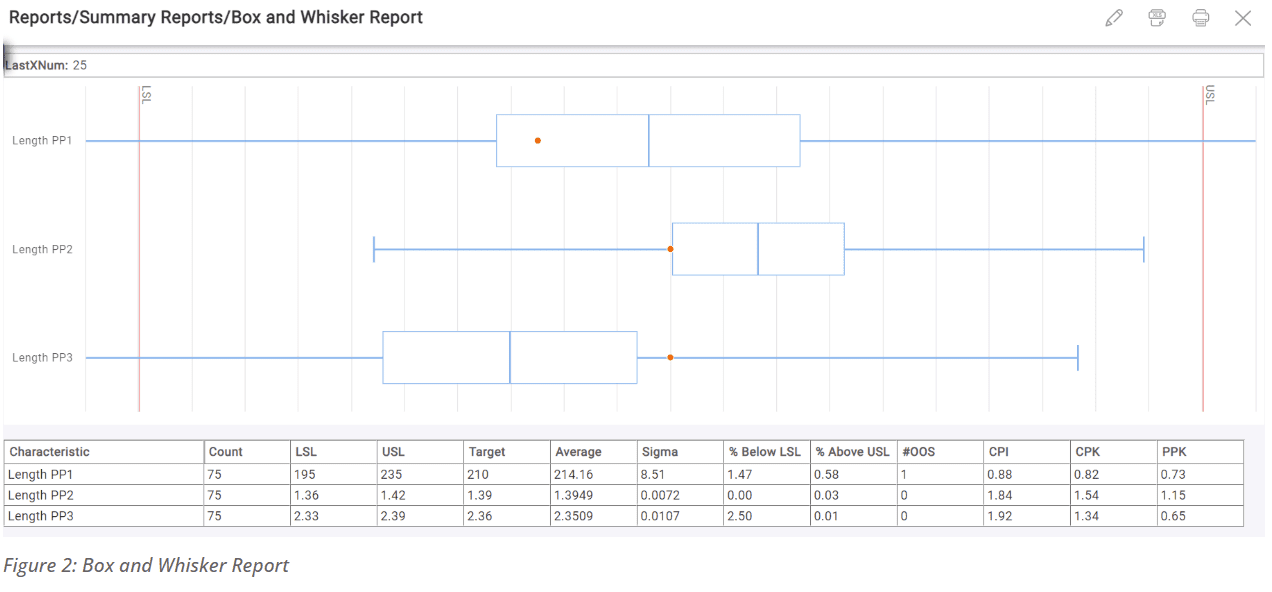
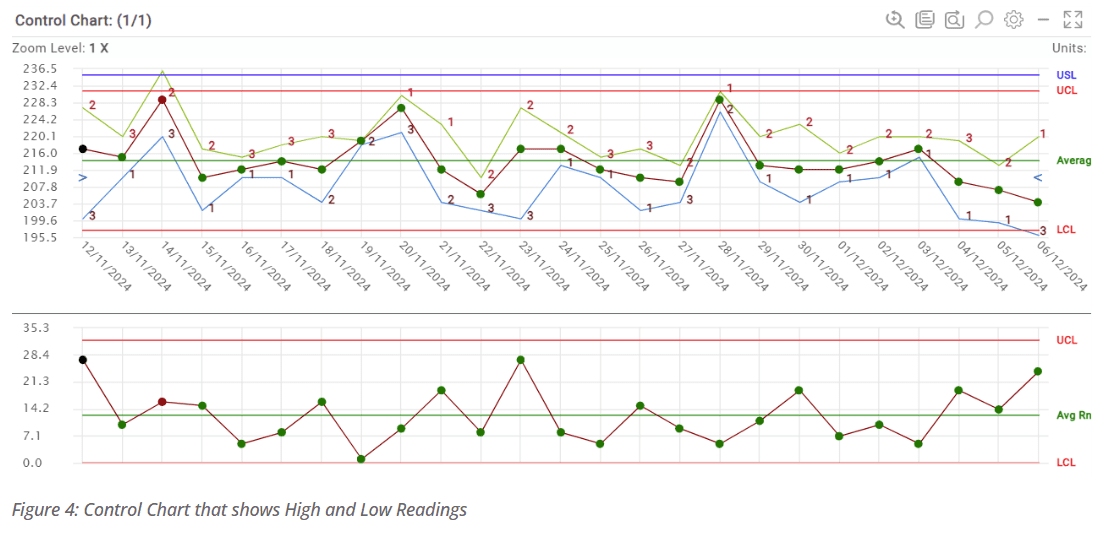
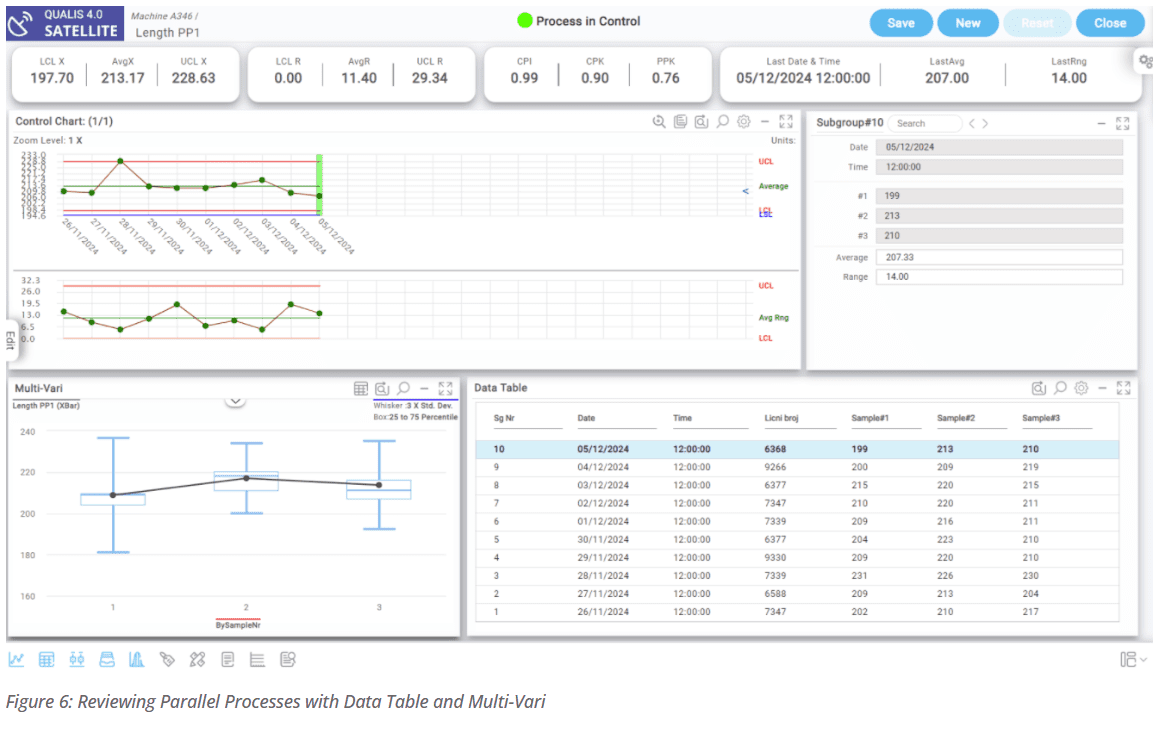
The Control Chart showing the highest and lowest reading shows the lines for the maximum and minimum values in the subgroup and puts the process number next to it (See Figure 4). If you see the same number too often you need to investigate that specific process (e.g. cavity) because the process average is deviating from the overall average. Next step could be to analyze the data with the Box and Whisker or Multi-Vari Analysis. To compare processes the operators or engineer often start by reviewing the individual measurements in a raw data table and then continue with multi-vari analysis (Box and Whiskers). Let’s say the user wants to see the variation between parallel processes for the last 10 subgroups. The user filters on the last 10 subgroups and then views the results, refer to Figure 6.
Exceptional Situations
If you select a specific method to apply SPC in case of parallel processes you have to take into account that there are exceptional production situations which will influence the results or reduce the efficiency of the SPC solution implemented. For different types of industries there are different exceptions but we limit ourselves here to two common exceptions:
1. One of the subprocesses is not active
2. The subprocesses are operating at a different level.
Ad 1: In many situation in parallel processes if can happen that one of the subprocesses is (temporarily) not active. For example a blocked cavity in injection moulding, a lane which is not used with solar cell manufacturing, etc. Your SPC program should allow you to efficiently handle these exceptions in real-time on the shop floor. DataLyzer Qualis SPC got this covered by allowing a certain level of ‘incomplete subgroups’.
Ad 2: If processes are operating at a different level and you combine subprocesses in one subgroup and you are not able to eliminate the difference, this will strongly influence the calculations of your control limits; it will widen your control limits. In this case you have to use a different method of calculating your control limits.
Conclusion
Datalyzer Qualis SPC facilitates SPC for parallel processes in many ways including handling all the exceptions efficiently.
The most important aspect of setting up a correct SPC method is to analyze the 3 types of variation and take into account what the consequences are of selecting one of the two methods or a combination of these methods.
Consequences need to be defined in terms of time and money for measurements but certainly also user friendliness and acceptance of the chosen method by the organization and customers.
9%
Cost Reduction Achieved by customers

What customers say
“Datalyzer helped us automatically link quality data from all processes for advanced analysis”
Dave Beeren
Yield Engineer, Philips
Industries we serve

ISO Certified
ISO 27001 & SOC2